Lower Layers (11): Memory and CPU Inside the OSD — from mempool to NUMA and Profiling
TL;DR this chapter in a few lines
- Most OSD performance complaints come down to memory (OOM kills) or one saturated thread or shard.
- Each PG's ops go to shard
ps % num_shards, so a hot PG can saturate one shard while others idle. - mempools count bytes and items per subsystem without locks; tcmalloc may keep freed memory, so RSS and the mempool total differ.
- PriorityCache splits
osd_memory_targetbetween onode, data and RocksDB caches; NUMA affinity and profiling (perf, flame graphs) find CPU hot spots.
33-1 Why memory and CPU?#
Most performance complaints about an OSD eventually come back to one of these two: either the OSD uses more than its share of memory (and the OOM killer kills it), or one thread or one shard is saturated while the rest are idle. This chapter examines the internal mechanisms of both, function by function: mempool for memory accounting, tcmalloc as the allocator, PriorityCache for dividing the memory budget among caches, the OSD's threads and how work is distributed among them, NUMA, and the measurement tools (perf, bpftrace and uftrace). All references are to main.
33-2 The threads of a classic OSD#
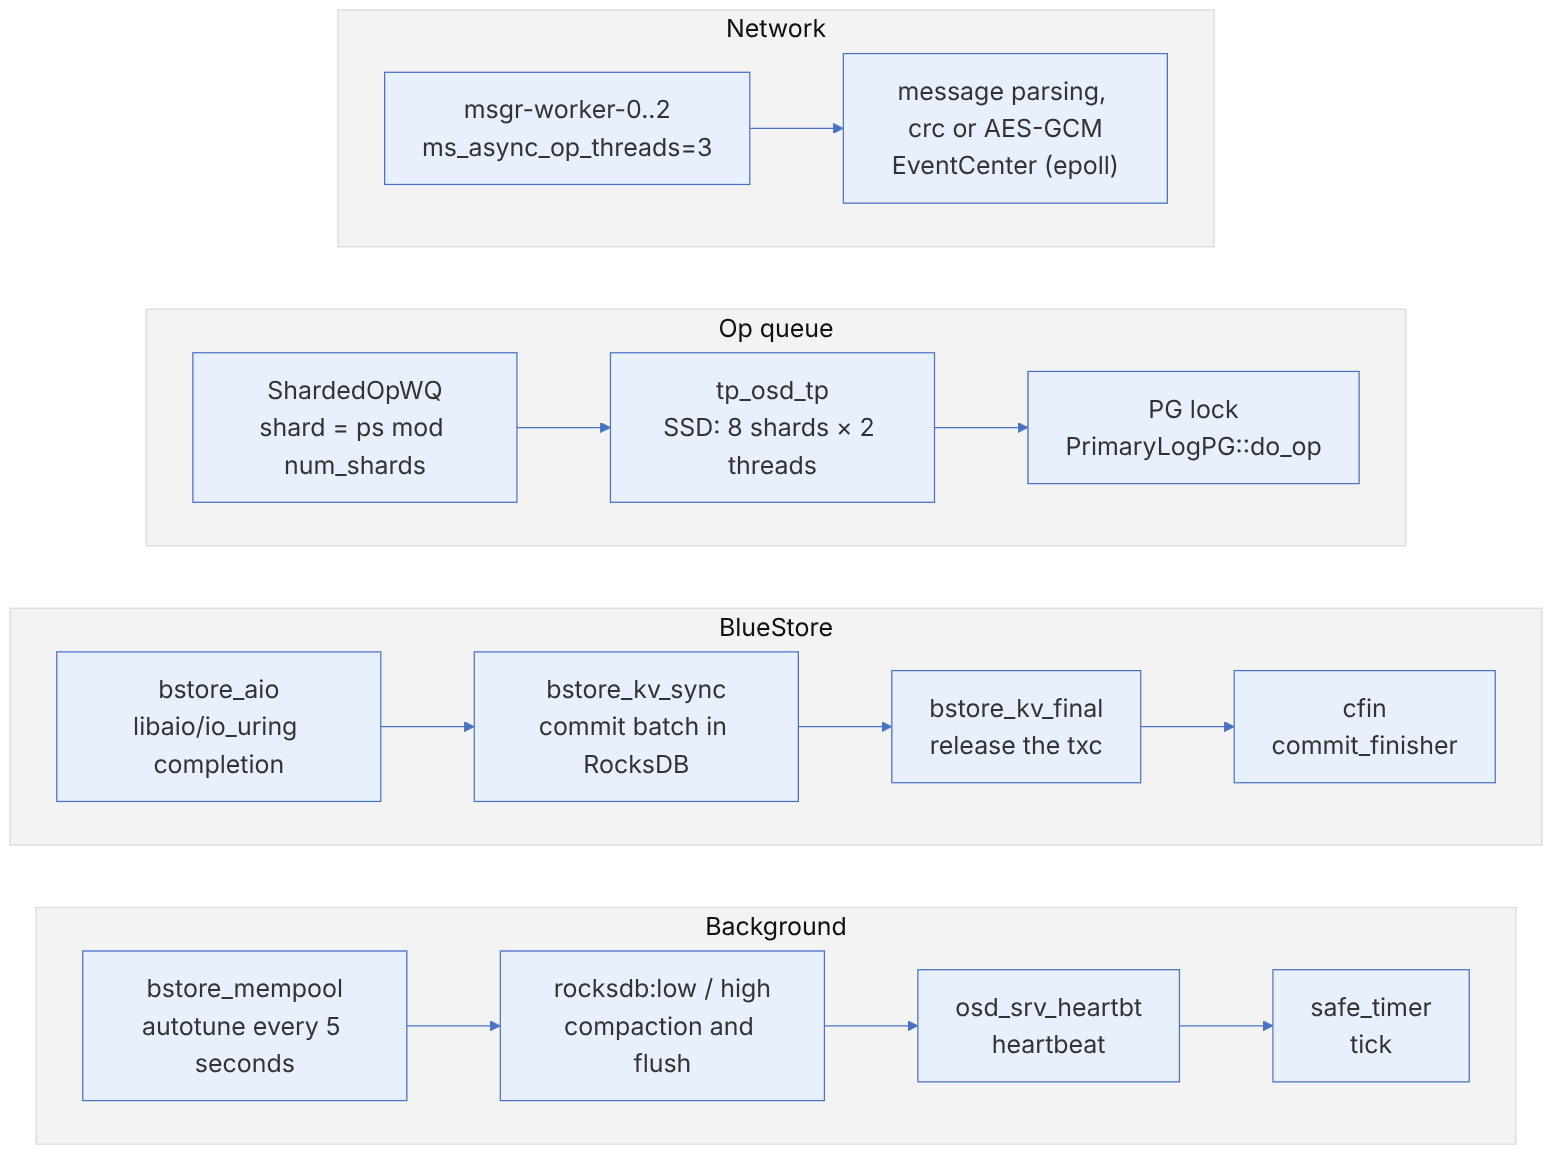
| Thread name | Created in the code | Default count | Note |
|---|---|---|---|
| msgr-worker-N | msg/async/Stack.h | ms_async_op_threads=3 | separate for each messenger (public and cluster) |
| tp_osd_tp | OSD.cc: osd_op_tp | shards × threads_per_shard: SSD 8×2=16, HDD 1×5=5 (since v19.2.1) | timeout 15 seconds and suicide 150 seconds |
| bstore_aio | blk/kernel/KernelDevice.cc | one per device | not in the SPDK path (chapter 31) |
| bstore_kv_sync | BlueStore.cc | 1 | a common bottleneck for small writes |
| bstore_kv_final | BlueStore.cc | 1 | runs on_commit |
| cfin | BlueStore.cc: commit_finisher | 1 | the commit finisher |
| bstore_mempool | BlueStore.h: MempoolThread | 1 | tune_memory every 1 second, balance every 5 seconds |
| osd_srv_heartbt | OSD.cc | 1 | a heartbeat every osd_heartbeat_interval=6 seconds |
| safe_timer | common/Timer.cc | several | OSD and mgr-client ticks |
33-2-1 Distributing ops among shards#
For each op, OSD::enqueue_op computes the shard index with pgid.hash_to_shard(num_shards). In osd_types.h this function is simply ps() % num_shards. All the ops of one PG are always queued in one shard and their order is preserved. But the distribution of load among shards depends on how the ps values of that OSD's PGs are spread.
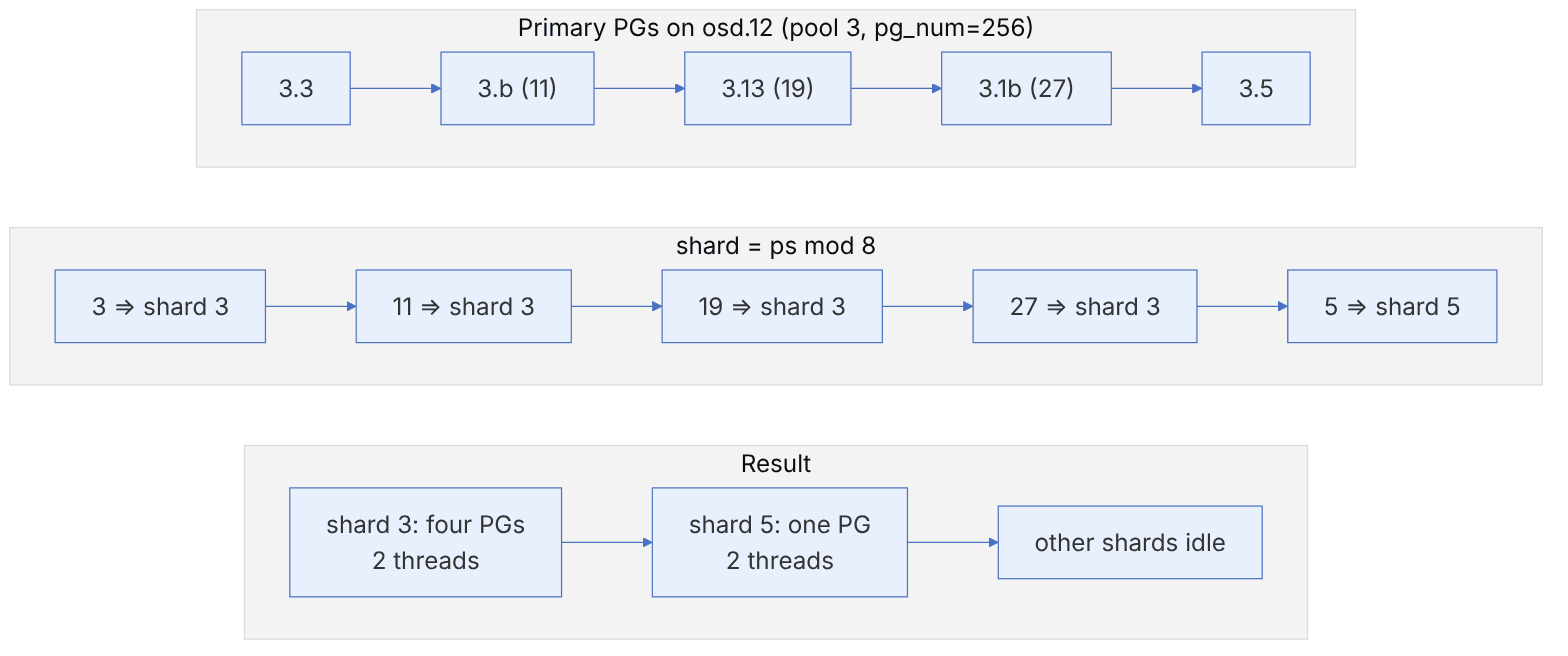
Source in code: src/osd/osd_types.h :: spg_t::hash_to_shard; src/osd/OSD.cc :: OSD::enqueue_op
Complexity: O(1)
shard_index = pg.ps mod num_shards                 # num_shards = osd_op_num_shards_ssd (8)
sdata = shards[shard_index]
sdata.shard_lock: enqueue(op) with the mClock or WPQ scheduler
thread t of that shard: dequeue ⇒ PG lock ⇒ do_op
only a thread with thread_index < num_shards also drains the context (oncommit) queue
Numerical example. An OSD in a cluster with 100 OSDs and a pool with pg_num=256 and size=3 has about 256×3/100 ≈ 7.7 PGs, of which about 2.6 are primary. With 8 shards, the probability that two primary PGs land in one shard is high (the birthday problem: for three PGs in 8 slots, ). When one PG carries most of the load (for example a busy RBD image), at most two threads work on it, because the PG lock limits parallel execution of one PG's ops. That is why increasing osd_op_num_threads_per_shard does not help a hot PG. Increasing pg_num (and so splitting the hot data) is the real solution.
Version-dependent. The HDD default in v19.2.0 was five shards with one thread, and since v19.2.1 it is one shard with five threads (chapter 21). The shard options are read only when the OSD starts, and changing them requires a restart.
33-3 mempool: lock-free accounting#
Every important data structure in Ceph is built with a mempool-specific allocator (for example mempool::bluestore_cache_onode::map). On allocation and free, this allocator updates the items and bytes counters of that pool. The challenge is that this update happens on the hot path, from dozens of concurrent threads. A shared atomic counter bounces its cache line between cores and costs hundreds of nanoseconds.
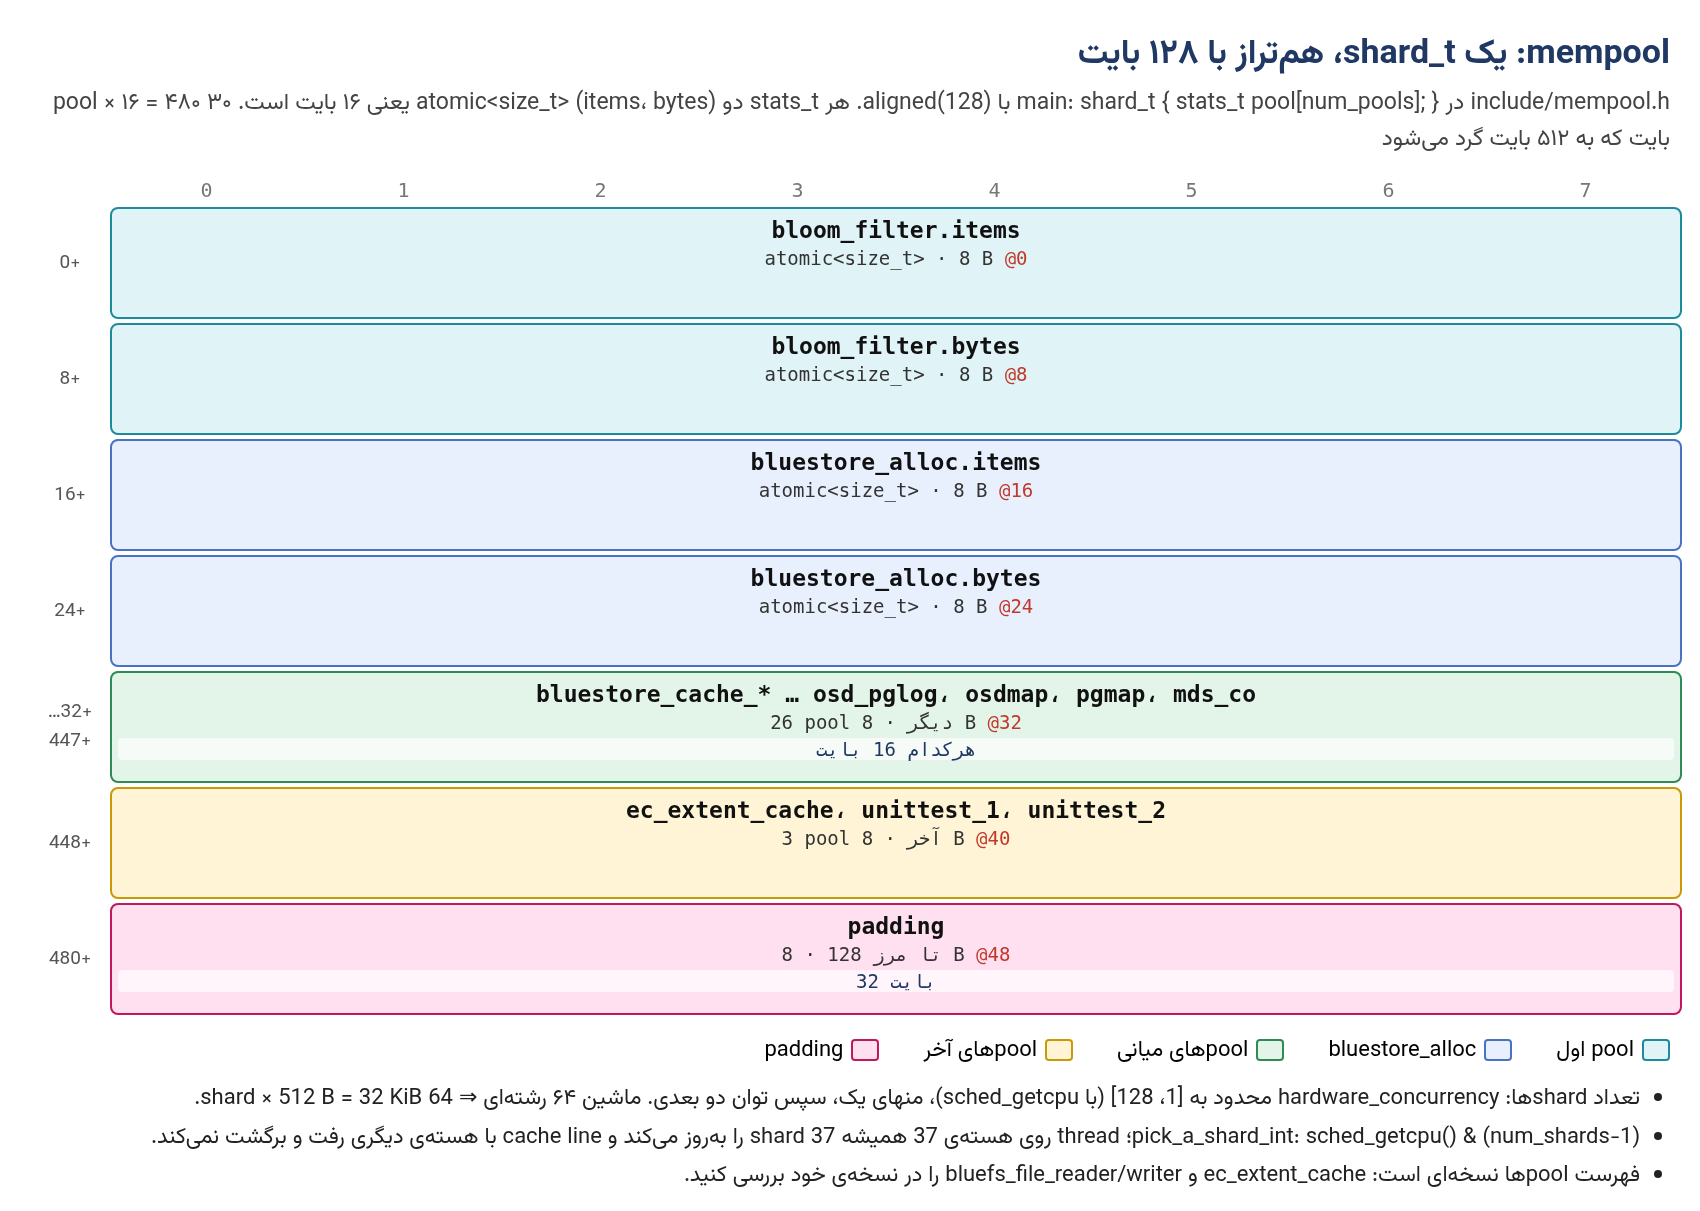
Source in code: src/common/mempool.cc :: get_num_shards, pick_a_shard_int; include/mempool.h :: pool_allocator::allocate
Complexity: O(1) contention-free update; reading the total O(num_shards)
init: threads = clamp(hardware_concurrency, MIN_SHARDS, 128) − 1
      bits = number of bits in threads ; num_shards = 1 << bits
allocate(n, T):
      shid = sched_getcpu() & (num_shards − 1)       # or a fixed round-robin per thread
      shards[shid].pool[ix].bytes += n × sizeof(T)    # atomic, but local to the core
      shards[shid].pool[ix].items += n
allocated_bytes(pool) = Σ over shards of bytes       # only when dumping
Numerical example. A machine with 48 hardware threads: threads = 48 − 1 = 47 = 0b101111 (6 bits), so num_shards = 64. Each shard_t, with 30 pools in main, is 480 bytes, rounded up to 512. The total is 64 × 512 = 32 KiB. A thread on core 37 always updates shard 37. The only possible contention is when a thread migrates between sched_getcpu() and the update, which is rare. A full dump is 64 × 30 additions, which costs nothing at once per second.
ceph tell osd.N dump_mempools shows only memory that went through the mempool allocators. RocksDB memory (except the block cache, which PriorityCache manages), memtables, thread stacks and tcmalloc fragmentation are not in it. A gap of a few hundred megabytes to over a gigabyte between RSS and the sum of the mempools is normal. osd_memory_base=768M is set aside exactly for this "unaccounted" part.
33-4 tcmalloc and "mapped" memory#
ceph-osd is linked with tcmalloc (from gperftools) by default. tcmalloc keeps memory at three levels: a per-thread cache, central free lists for each size class, and the page heap, which gets spans from the operating system. Freed memory does not necessarily go back to the operating system. Only when a span is completely free and ReleaseFreeMemory or gradual release returns it with madvise is it counted in pageheap_unmapped_bytes.
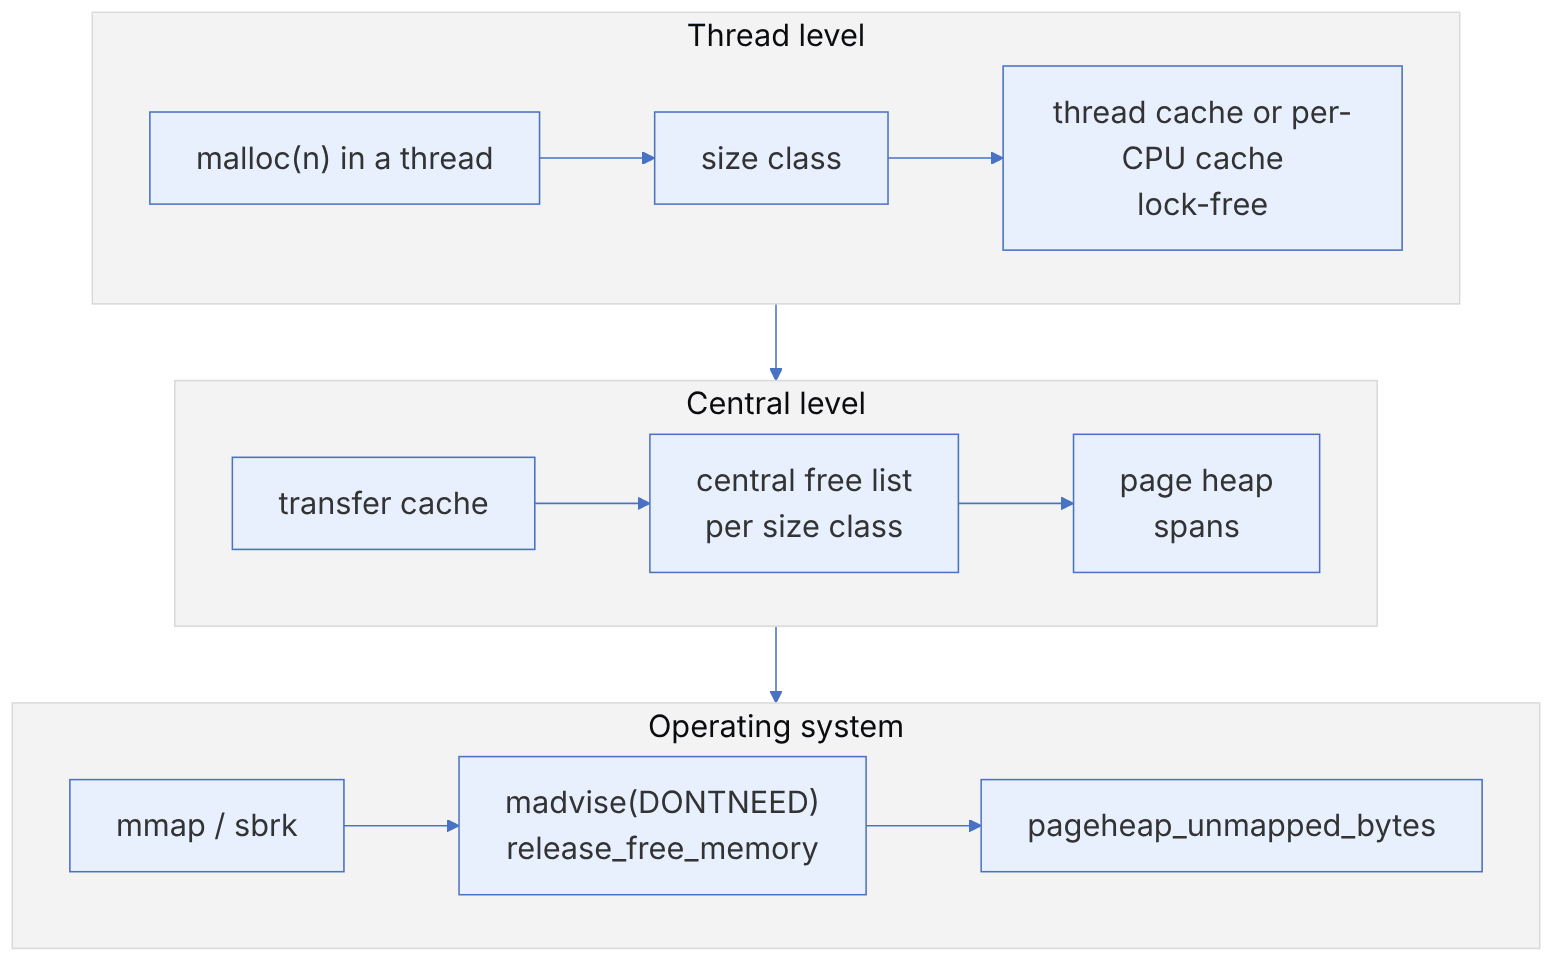
The packages' environment file (etc/sysconfig/ceph in the repository) sets TCMALLOC_MAX_TOTAL_THREAD_CACHE_BYTES=134217728 (128 MiB). This is the limit for all thread caches in the process. If it is lower, the op threads go to the central free list (with a lock) more often. If it is higher, more memory is "hidden" in thread caches. A cephadm deployment sets the container's environment variables separately. Read the real value with ceph tell osd.N heap stats.
33-5 PriorityCache: dividing the memory budget#
33-5-1 From osd_memory_target to the cache budget#
BlueStore::MempoolThread::_update_cache_settings and _resize_shards set three numbers for the PriorityCache::Manager (named "bluestore-pricache"):
target  = osd_memory_target                         (4 GiB)
ltarget = (1 − osd_memory_expected_fragmentation) × target = 0.85 × 4096 = 3481.6 MiB
max     = ltarget − osd_memory_base = 3481.6 − 768 = 2713.6 MiB    (if ltarget > base + min)
min = osd_memory_cache_min = 128 MiBSource in code: src/common/PriorityCache.cc :: PriorityCache::Manager::tune_memory
Complexity: O(1) per round (every osd_memory_cache_resize_interval = 1 second)
mapped = heap_size − pageheap_unmapped_bytes        # from tcmalloc
new = clamp(tuned_mem, min, max)
if mapped < target:  new += (1 − mapped/target) × (max − new)      # approach max slowly
else:                new −= (1 − target/mapped) × (new − min)      # pull back quickly
tuned_mem = new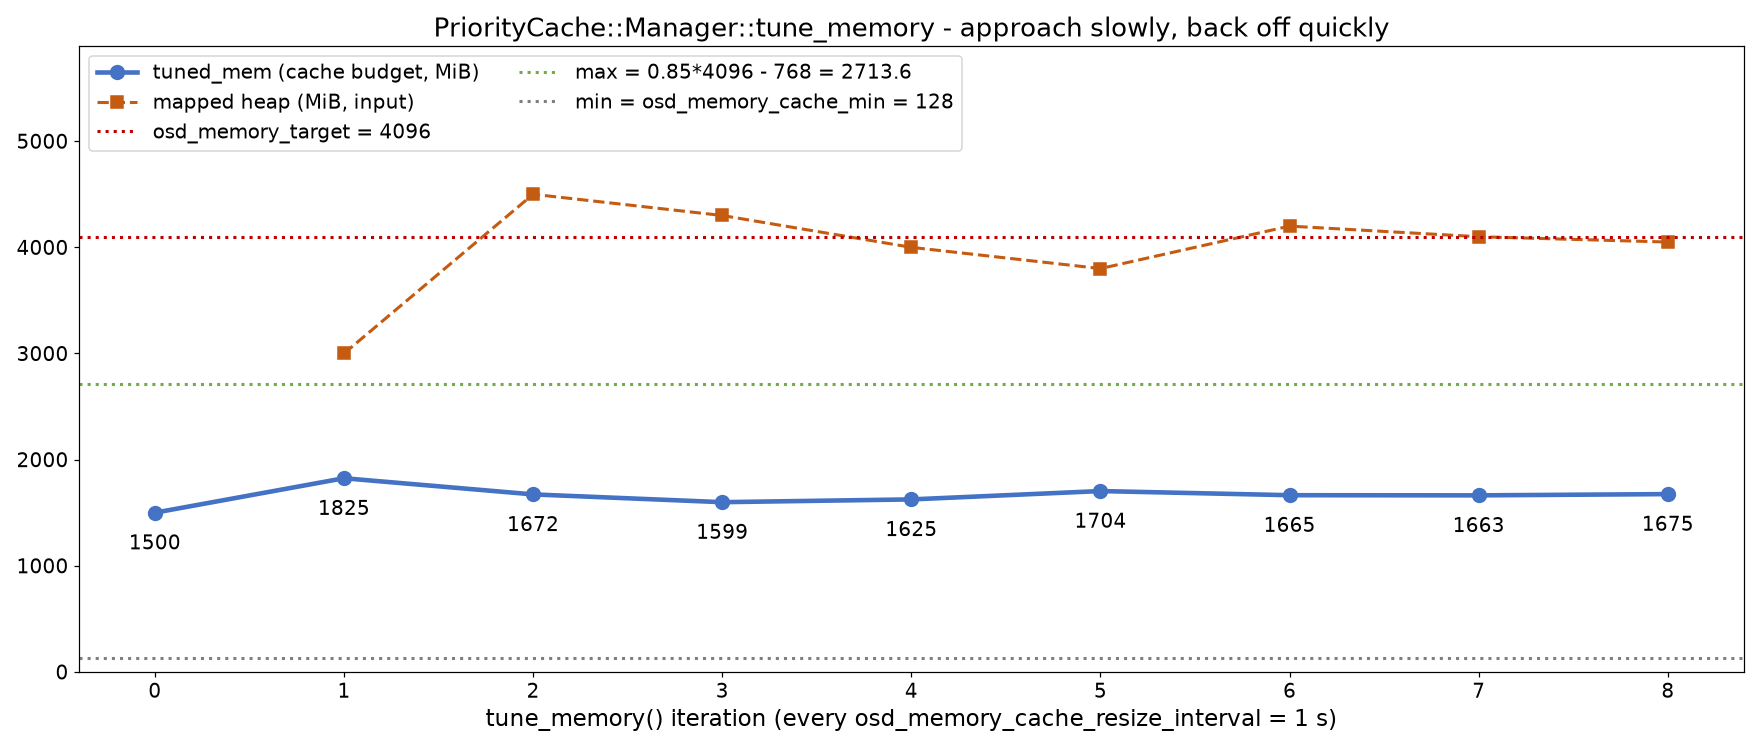
Numerical example (the first two rounds of the figure). tuned_mem=1500 and mapped=3000: ratio = 1 − 3000/4096 = 0.2676, so new = 1500 + 0.2676 × (2713.6 − 1500) = 1824.7 MiB. Next round, mapped=4500: ratio = 1 − 4096/4500 = 0.0898, so new = 1824.7 − 0.0898 × (1824.7 − 128) = 1672.4 MiB. The phrase "approach slowly, bounce away quickly" appears in the code itself. When the gap between mapped and target is large, the increase factor is large, but it shrinks as they get closer. The decrease is proportional to the distance to min, so with large budgets the absolute decrease is larger.
Why an OSD sometimes uses more than osd_memory_target. This feedback loop only shrinks the size of the caches. If unaccounted memory (the pg log during recovery, messenger buffers under pressure, many osdmaps) by itself exceeds the target, the OSD goes over the target even with the cache at its minimum of 128 MiB. osd_memory_target is not a hard limit. In a container, the default osd_memory_target_cgroup_limit_ratio=0.8 sets the target to 80% of the cgroup limit to keep this margin.
33-5-2 balance: dividing among caches and priorities#
BlueStore registers four caches in the Manager: kv (the RocksDB block cache), kv_onode, meta (onodes) and data (buffers). The ratios come from bluestore_cache_kv_ratio=0.45, bluestore_cache_meta_ratio=0.45 and bluestore_cache_kv_onode_ratio=0.04, and data gets the remainder (about 0.06). Each cache places its data in bins by age. Priorities PRI1 to PRI10 map to age ranges (newer = higher priority). PRI0 is reserved for RocksDB indexes and filters.
Source in code: src/common/PriorityCache.cc :: Manager::balance, balance_priority; BlueStore.h :: MempoolCache::request_cache_bytes
Complexity: O(L × R × C) for L priorities, R rounds and C caches
mem_avail = tuned_mem − C × get_chunk(1, tuned_mem)          # reserve one chunk per cache
for pri in PRI0..PRI11:
    pending = all caches; ratios = Σ ratio
    while pending and mem_avail > |pending|:
        for c in pending:
            want = c.request_cache_bytes(pri)                     # what it has in this priority's bins − already assigned
            share = mem_avail × c.ratio / ratios
            if want > share: c.add(pri, share)                    # stays for the next round
            else: c.add(pri, want); pending.remove(c)
        mem_avail −= assigned; ratios = Σ ratio of remaining
    PRI11 (LAST): the remainder is divided by the ratios alone
commit: each cache is rounded to a multiple of get_chunk (usage + 64 MiB, with a chunk between 4 and 64 MiB)
Numerical example. tuned_mem=1672 MiB. get_chunk: 1672 is rounded up to the next power of two, 2048 MiB, and divided by 256 gives 8 MiB (between 4 and 64). get_chunk(1) is 1 byte + 64 MiB, rounded to a multiple of 8 MiB, that is 72 MiB. Four caches × 72 = 288 MiB reserved, so mem_avail = 1384 MiB.
- PRI0: only kv asks (assume 200 MiB of indexes and filters). Its share is 0.45 × 1384 = 622.8, and it gets all 200. mem_avail = 1184.
- PRI1, round 1 (assumed requests: kv 300, meta 900, data 100, kv_onode 50): the shares are 532.8, 532.8, 71.0 and 47.4 MiB. kv gets its full request (300) and leaves. The rest get their full shares and stay. The total assigned is 951.2, so mem_avail = 232.8 and the remaining ratios sum to 0.55.
- PRI1, round 2: meta 0.45/0.55 × 232.8 = 190.5 (it still wants 367.2), data 25.4 (it still wants 29) and kv_onode takes only its remaining 2.6. After a few more rounds, mem_avail falls below the number of caches and the lower priorities get nothing.
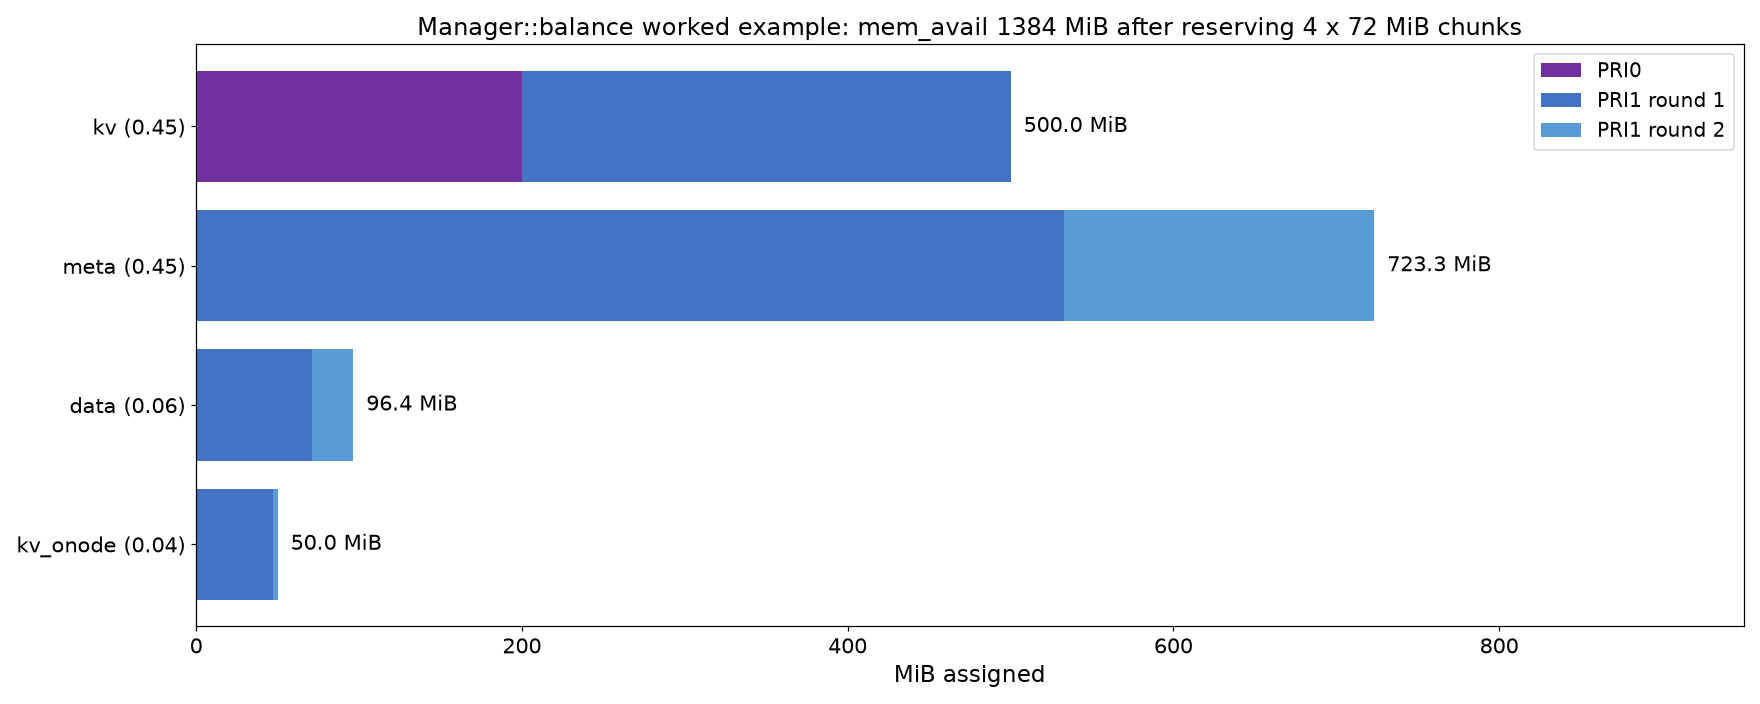
The practical consequence of this example: on an OSD that is short of memory, the fresh data of all caches is provided for before the old data of any cache. If the frequently used onodes do not fit in meta, every read has an extra trip to RocksDB (chapter 25). The bluestore-pricache:meta counters and similar ones in perf dump (the fields pri0_bytes to pri11_bytes, committed_bytes and reserved_bytes) show exactly where the budget went.
33-6 NUMA#
On dual-socket servers, access to the memory or a PCIe device of the other socket goes through the inter-socket link and has worse latency and bandwidth. OSD::set_numa_affinity handles this automatically.
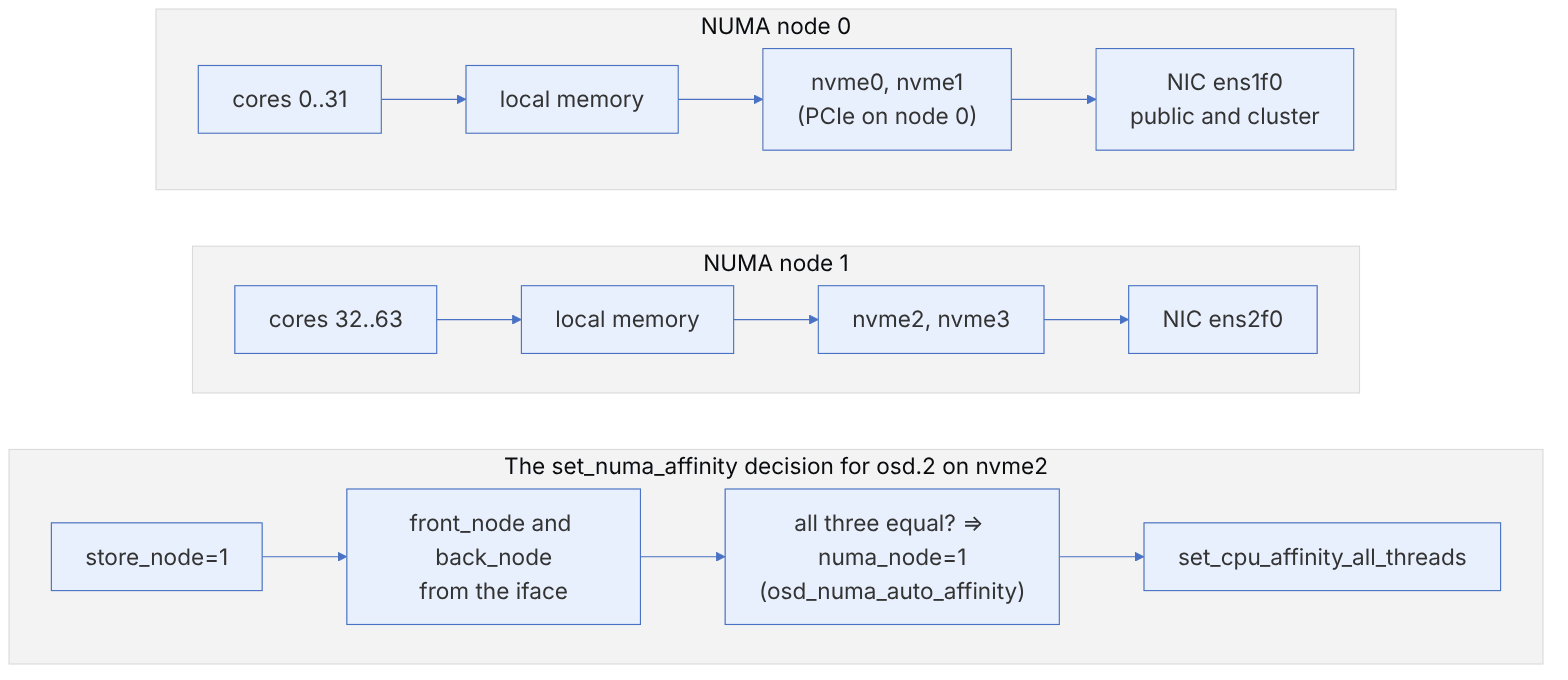
Source in code: src/osd/OSD.cc :: OSD::set_numa_affinity
Complexity: O(1) at startup
store_node = store.get_numa_node()
front = iface_numa(public addr); back = iface_numa(cluster addr)
if front == back == store_node and osd_numa_auto_affinity: node = front
if osd_numa_node ≥ 0: node = osd_numa_node                # the manual setting takes priority
if node ≥ 0: set_cpu_affinity_all_threads(cpus(node))
Example. A host with two nodes: nvme0, nvme1 and the first NIC on node 0, and nvme2, nvme3 and the second NIC on node 1. For osd.2 on nvme2, if public and cluster are both on the second NIC, the OSD is automatically bound to cores 32 to 63. If the public network is on the first NIC, the message "public and cluster network numa nodes do not match" appears in the log and no affinity is set. osd_numa_prefer_iface=true makes the OSD prefer, when choosing an address, the IP on the interface on the same node as the device. The ceph osd numa-status command shows the state for all OSDs.
33-7 Profiling#
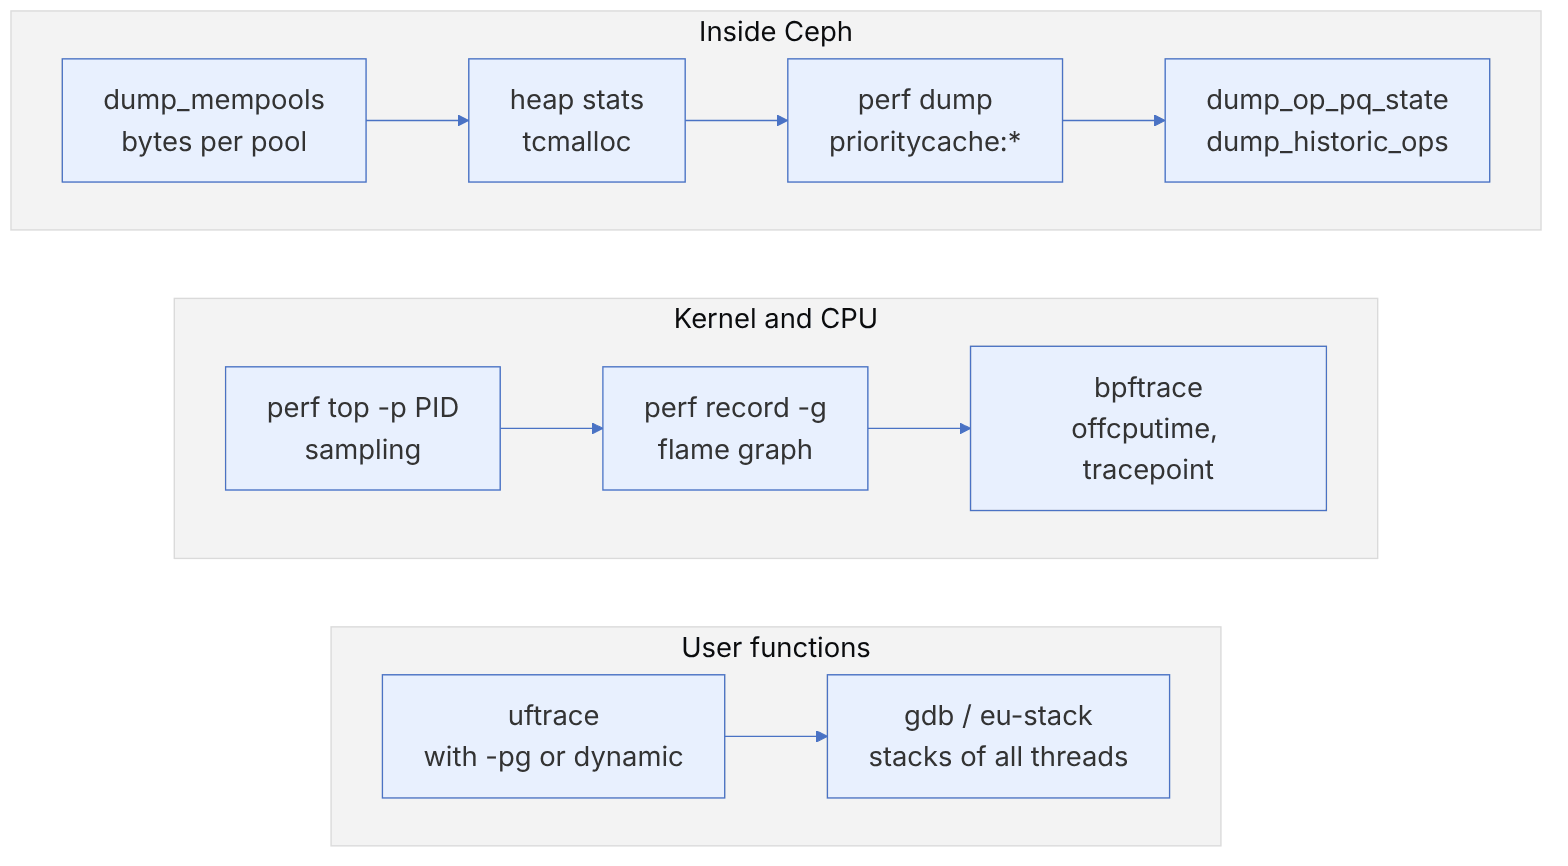
ceph tell osd.3 dump_mempools | jq '.mempool.by_pool | to_entries | sort_by(-.value.bytes) | .[:5]'
ceph tell osd.3 heap stats
ceph tell osd.3 perf dump | jq '."bluestore-pricache:meta"'
ceph osd numa-status
top -H -p $(pidof ceph-osd)                     # thread names
perf record -F 99 -g -p PID -- sleep 30 && perf script | stackcollapse-perf.pl | flamegraph.pl > osd.svg
bpftrace -e 'kprobe:finish_task_switch /pid == PID/ { @[kstack, comm] = count(); }'   # approximate off-CPU
uftrace record --no-libcall -P 'BlueStore::_txc_.*' -- ceph-osd -f --id 3   # run a test OSD under uftrace (uftrace launches the process itself)
eu-stack -p PID > stacks.txt                    # all threads, without a long pause
Reasoning about the CPU budget per op (a hypothetical model). Suppose an OSD on NVMe with 16 tp_osd_tp threads does 30 thousand 4 KiB writes per second, and perf shows ceph-osd using about 6 full cores. The budget = 6 / 30000 = 200 microseconds of CPU per op (including the replica). If the flame graph shows 15% in crc32c and msgr2 encryption, 35% in PrimaryLogPG and building the transaction, 30% in BlueStore and RocksDB and 20% in the messenger and memory allocation, removing encryption (crc mode instead of secure) saves at most 30 microseconds. By contrast, reducing RocksDB write amplification (chapter 25) affects a larger share. This kind of "share × budget" calculation before any tuning prevents ineffective optimizations. Measure the real numbers yourself.
33-8 mempools with real data#
This section shows real mempool numbers from three BlueStore OSDs of a test cluster running Ceph 18.2.7. The output of ceph daemon osd.N dump_mempools reports each pool with two numbers: items and bytes. The ratio of the two is the "cost per item", and it is the best way to estimate memory at scale.
33-8-1 pg log length and the per-OSD budget#
Source in code: OSDService::get_target_pg_log_entries in src/osd/OSD.cc; trimming in PeeringState::calc_trim_to with osd_pg_log_trim_min = 100
Complexity: O(1) per PG
pseudocode
num_pgs = number of PGs on this OSD (primary and replica)
target = osd_target_pg_log_entries_per_osd        # default 300000
if num_pgs > 0 and target > 0:
    entries = max(min(target / num_pgs, osd_max_pg_log_entries = 10000), osd_min_pg_log_entries = 250)
else entries = osd_min_pg_log_entries
trimming happens only when at least osd_pg_log_trim_min entries can be removed ← the length rises to about entries + 100
trimmed entries move to dups (up to osd_pg_log_dups_tracked = 3000); both are in the osd_pglog mempool
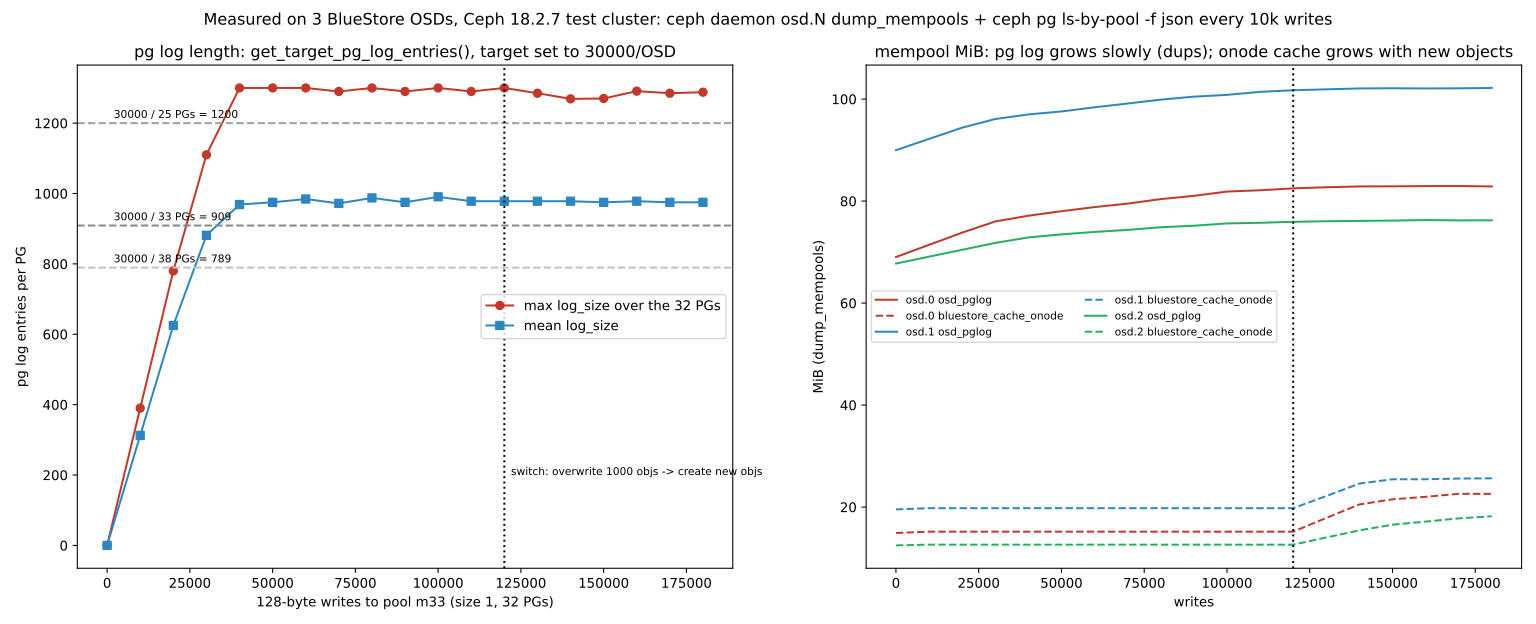
The experiment. To see the limit early, we set osd_target_pg_log_entries_per_osd to 30000. Then on the pool m33 (32 PGs, size = 1) we did one hundred and twenty thousand 128-byte writes to 1000 objects (overwrites), followed by sixty thousand writes to new objects. Every ten thousand writes we read the mempools and the log_size of all PGs.
The result. The OSDs had 33, 38 and 25 PGs, so the budgets were 909, 789 and 1200. The log length levelled off at around 40 thousand writes. The average was about 980 and the maximum 1300, which is that 1200 plus at most 100 entries waiting to be trimmed. After reaching the limit, the osd_pglog mempool still grew slowly: on osd.0 from 79.7 to 86.5 MiB. The reason is that trimmed entries go to dups, and dups are in the same mempool (mempool::osd_pglog::list<pg_log_dup_t> dups in osd_types.h). In this period each new item cost about 110 bytes on average, compared with about 300 bytes when the log was first filling up.
33-8-2 Cost per item#
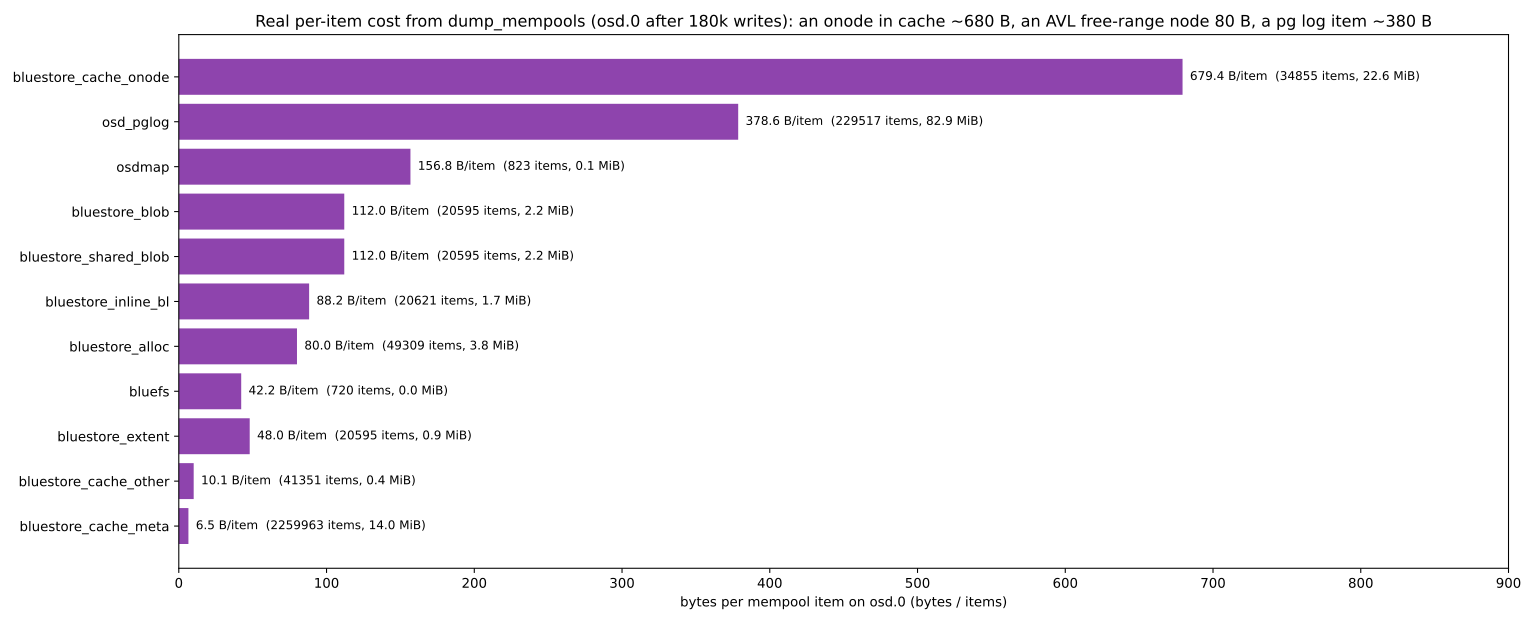
From the last sample of osd.0 (after 180 thousand writes) these costs were obtained:
| mempool | Bytes per item | Takeaway |
|---|---|---|
| bluestore_cache_onode | 679.4 | each onode in the cache is about 680 bytes. One million onodes in the cache is about 650 MiB |
| osd_pglog | 378.6 | the mixed average of log entries and dups |
| bluestore_blob and bluestore_shared_blob | 112.0 | per blob |
| bluestore_inline_bl | 88.2 | small inline data |
| bluestore_alloc | 80.0 | equal to the size of a range_seg_t node in the AVL/hybrid allocator (chapter 24) |
| bluestore_extent | 48.0 | per logical extent |
Use these numbers directly for estimates. For example, 300000 pg log entries per OSD at about 380 bytes is roughly 110 MiB, and that is without dups. If the dups fill up to 3000 per PG, on an OSD with 200 PGs another 600000 dups are added.
These are not outside the cache budget in osd_memory_target. PriorityCache tunes only the BlueStore and RocksDB caches. The pg log is fixed memory that is subtracted from the cache's share.
The 80 bytes for bluestore_alloc is the same as the size of range_seg_t that we derived from the code in chapter 24. This match is an independent check of that number.
33-9 Supplementary and up to date#
- The list of mempool pools in main includes
ec_extent_cache,bluefs_file_readerandbluefs_file_writer. Check which pools exist in your version withdump_mempools. - In Crimson (chapter 30), instead of a thread pool, each reactor has one core and Seastar has its own per-core allocator. The memory and CPU model of this chapter applies only to the classic OSD.
osd_memory_target_autotune(default false) lets cephadm set the target at the host level, based on the total memory and the number of OSDs. This setting is made outside the OSD and has nothing to do with the tune_memory loop inside the OSD.- PriorityCache is also used in the mons for the RocksDB and osdmap caches (the
mon_memory_targetandmon_memory_autotuneoptions).
33-10 Hands-on exercise#
- 1. On a test OSD, reduce
osd_memory_targetto 2 GiB and record thebluestore-pricachesection ofperf dumpevery 5 seconds. Compare the gradual decrease of committed_bytes with the tune_memory model. - 2. Compute the mempool num_shards for your own machine from nproc.
- 3. List an OSD's primary PGs with
ceph pg ls-by-primary osd.N, compute each PG's ps modulo 8 and estimate the load of the shards. - 4. Build a flame graph of the OSD with
perf recordduringrados bench -t 64 writeand read the shares of crc32c, RocksDB and tcmalloc. - 5. Run
ceph osd numa-statusand explain for each OSD why NUMA affinity was or was not set.
33-11 Review questions#
- 1. Why does mempool use shards instead of one shared atomic counter, and how is the shard chosen?
- 2. Why is the size of shard_t a multiple of 128?
- 3. Compute, with the defaults, the two numbers derived from osd_memory_target as the max and min of the cache budget.
- 4. How does tune_memory behave differently when increasing and when decreasing?
- 5. Why is osd_memory_target not a hard limit?
- 6. In balance, what happens to a cache that asks for less than its share, and who gets the remainder?
- 7. What is get_chunk for a tuned_mem of 1672 MiB?
- 8. Why does increasing threads_per_shard not help a hot PG?
- 9. Under what condition does the OSD set NUMA affinity automatically?
- 10. How do you compute the "CPU budget per op", and what do you conclude from it?
Answers to these questions are in Appendix E: Answers to Review Questions. Answers to this chapter's questions →
33-12 Sources for this chapter#
- BlueStore memory configuration
https://docs.ceph.com/en/latest/rados/configuration/bluestore-config-ref/ - OSD option reference
https://docs.ceph.com/en/latest/rados/configuration/osd-config-ref/ - mempool
https://github.com/ceph/ceph/blob/main/src/include/mempool.h - PriorityCache
https://github.com/ceph/ceph/blob/main/src/common/PriorityCache.cc - BlueStore MempoolThread
https://github.com/ceph/ceph/blob/main/src/os/bluestore/BlueStore.cc - NUMA in the OSD
https://github.com/ceph/ceph/blob/main/src/osd/OSD.cc - tcmalloc (gperftools
https://github.com/gperftools/gperftools - perf
https://perfwiki.github.io/main/ - bpftrace
https://github.com/bpftrace/bpftrace - uftrace
https://github.com/namhyung/uftrace - Flame graphs
https://www.brendangregg.com/flamegraphs.html