From VSM to the Ceph Dashboard: Graphical Cluster Management
TL;DR this chapter in a few lines
- The Ceph Dashboard is an MGR module: a Python REST API plus an Angular UI on that same API, enabled by default by cephadm.
- Role-based access control (roles over scopes) and SSO control who may do what; every action is recorded in the audit log.
- Tentacle adds mgmt-gateway and oauth2-proxy: one front door for the Dashboard, Grafana, Prometheus and Alertmanager.
- Every Dashboard step has a CLI equivalent; the data is read from ceph-mgr's memory, so it is as fresh as the OSDs' periodic reports.
9-1 Before you start#
9-1-1 Why has this chapter been rewritten?#
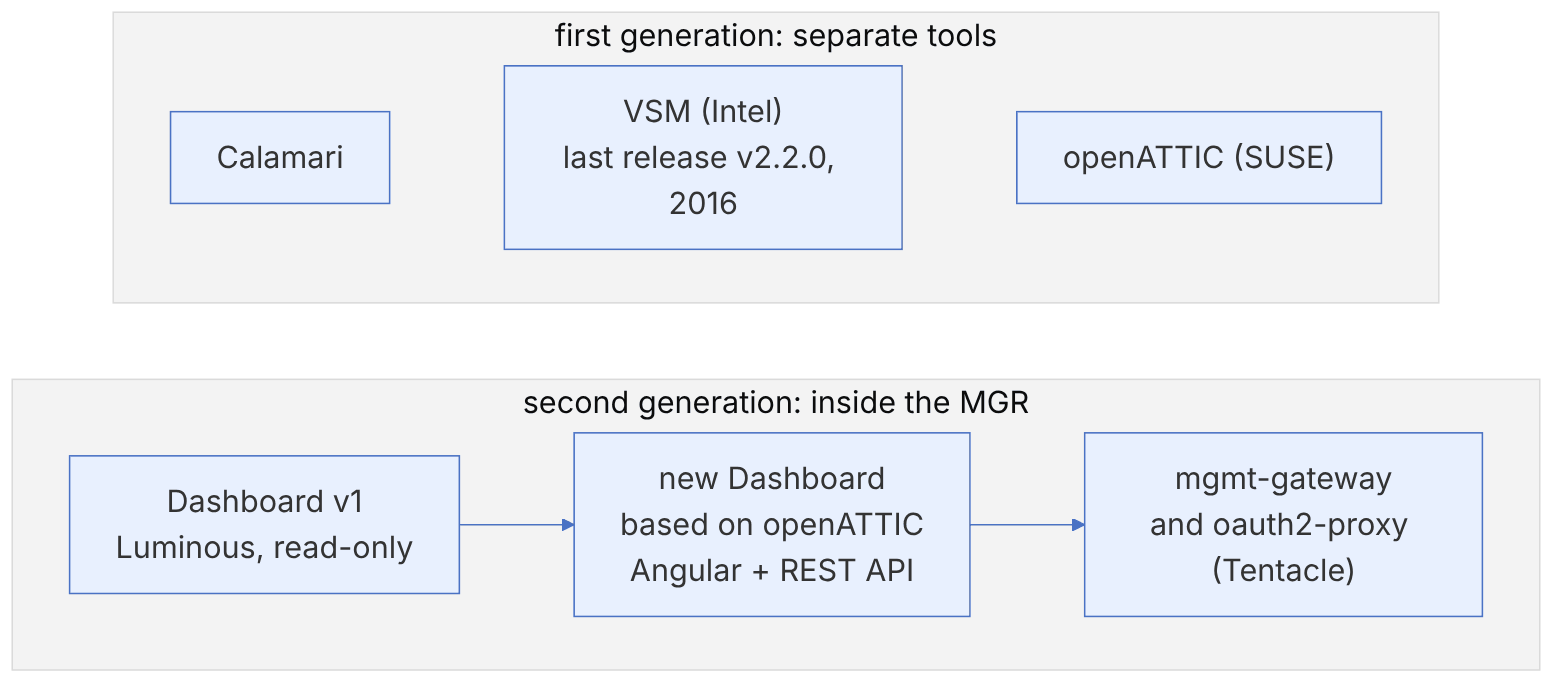
Before the Dashboard, one of the well-known graphical management tools was Virtual Storage Manager (VSM): an open-source tool Intel developed for building and managing a Ceph cluster through a web interface. Today the status of this tool is clear: its GitHub repository (intel/virtual-storage-manager) is archived, its last published release is v2.2.0 from July 2016, and the last code change dates back to March 2017. VSM worked only with old Ceph releases (before Luminous) and has no maintenance path.
So instead of teaching how to install VSM, this chapter addresses the same need: graphical management of a Ceph cluster. Today's tool for this is the Ceph Dashboard, which is part of Ceph itself. We start the chapter with a short look at the history to make clear where VSM's ideas went.
- What was VSM, and why was it dropped?
- What is the architecture of the Ceph Dashboard, and how is it enabled and secured?
- How do we configure users, roles and SSO?
- How do we use the Dashboard for building, monitoring and upgrading?
- What did mgmt-gateway and oauth2-proxy add in Tentacle?
- What are the limits of graphical management, and what is its right place next to the CLI and GitOps?
9-2 History: from separate tools to the Dashboard#
9-2-1 VSM at a glance#
VSM had two main components: a central controller (web interface, API and database) and an agent on each storage node that executed the controller's commands. Its key ideas were:
- Predefined storage groups: the administrator described the hardware in manifest files (which disk is SSD, which HDD, which node is in which zone), and VSM built the cluster on that basis.
- Building the cluster, adding nodes and upgrading through the web interface.
- A status dashboard and integration with OpenStack.
Interestingly, many of these ideas exist in Ceph itself today, but in a different form: the "storage group" became the device class and CRUSH rules (chapter 8), the hardware manifest became service specs in cephadm (chapter 11), and the web interface became the Dashboard. The main difference is that they are now all inside the main project and are updated with every Ceph release.
9-2-2 Why were the separate tools dropped?#
A management tool maintained outside Ceph must be adapted to every Ceph release; when the team or company behind it changes its priorities, the tool stops working. With the introduction of the MGR in Luminous, Ceph provided a platform on which management tools run as Python modules inside Ceph itself and have direct access to the cluster state. The first version of the Dashboard in Luminous was read-only; the next version was rewritten on the architecture and code of openATTIC (developed by the SUSE team) and became a full management tool.
9-3 Ceph Dashboard architecture#
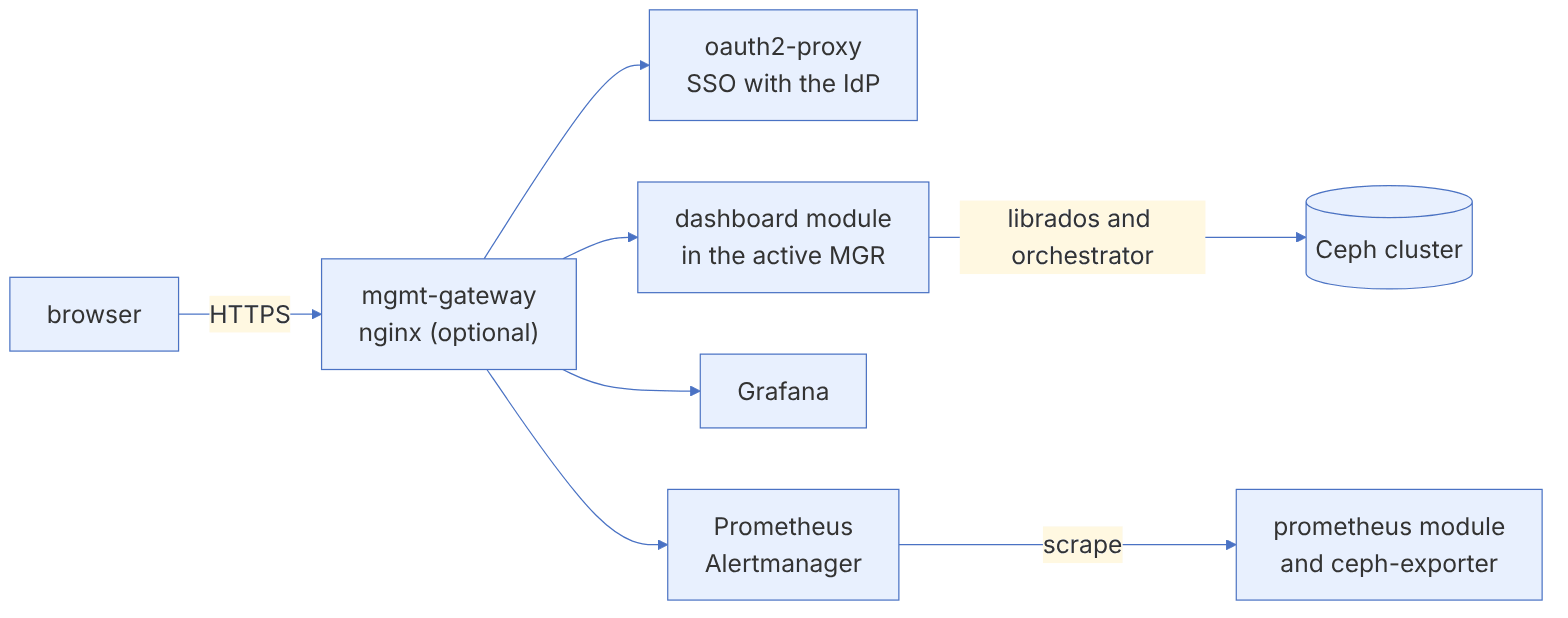
The Dashboard is an MGR module: a Python web server (CherryPy) that provides a REST API, and an Angular user interface that uses this same API. This means:
- Anything you do in the web interface can also be done and automated through this API.
- The Dashboard is served only by the active MGR; if the MGR changes, the address changes too (unless a load balancer or mgmt-gateway sits in front of it).
- For deployment operations (adding hosts, OSDs, services) it uses the orchestrator (cephadm or Rook). Without an orchestrator, parts of the interface are read-only.
- Performance charts are drawn in Grafana and the Dashboard shows them inside its pages; alerts come from Prometheus and Alertmanager (chapter 20).
9-4 Enabling and security#
9-4-1 Enabling#
In a cluster built with cephadm, the Dashboard is enabled by default and cephadm bootstrap prints the address and the initial password. To check or enable it by hand:
ceph mgr module ls | grep -i dashboard
ceph mgr module enable dashboard
ceph mgr services                     # current address of the Dashboard, Prometheus, ...
ceph dashboard create-self-signed-cert     # for labs only
9-4-2 A valid certificate#
In a real environment, install an organisational or Let's Encrypt certificate:
ceph dashboard set-ssl-certificate -i dashboard.crt
ceph dashboard set-ssl-certificate-key -i dashboard.key
ceph mgr module disable dashboard && ceph mgr module enable dashboardBy default the Dashboard listens on port 8443 (HTTPS). If you have several MGRs, you can configure the standby MGRs to redirect requests to the active MGR or return a specific error (the standby_behaviour setting); this is useful for putting the Dashboard behind a load balancer with a health check.
9-4-3 The initial admin user#
Read the password from a file so that it does not show up in the shell history or the process list:
umask 077
openssl rand -base64 18 > /root/dash-admin.pw
ceph dashboard ac-user-create admin2 -i /root/dash-admin.pw administrator
shred -u /root/dash-admin.pw            # after storing it in the organisation's password manager
ceph dashboard ac-user-show admin2The Dashboard gives full administrative access to the cluster; do not expose it directly on the internet. Restrict access to the management network or a VPN, enable SSO or at least a strong password policy and password expiry, and remove or disable unused default accounts.
9-5 Users, roles and SSO#
9-5-1 The access model#
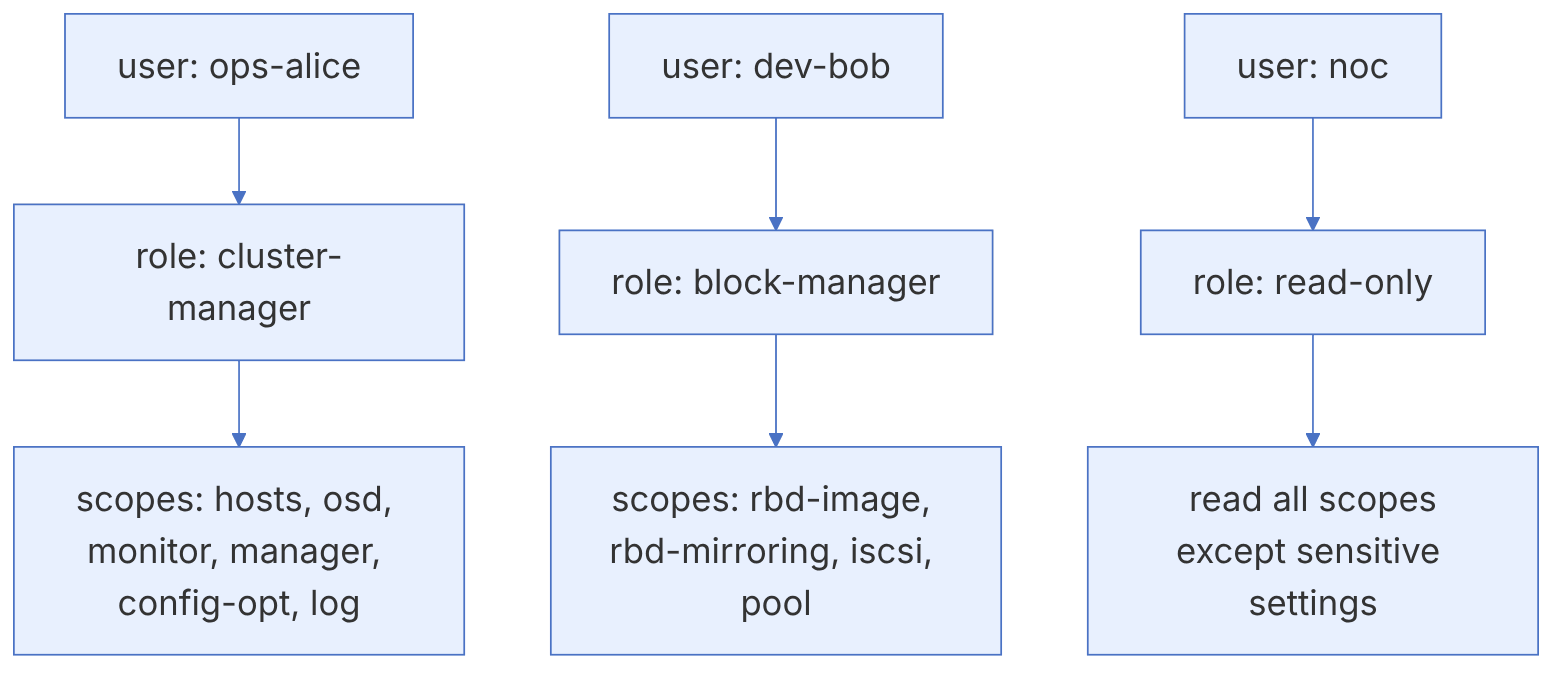
The Dashboard has role-based access control (RBAC). Each role is a set of permissions (read, create, update, delete) on scopes such as pool, rbd-image, osd, hosts, cephfs, rgw or config-opt. The predefined roles:
| Role | Scope of access |
|---|---|
| administrator | All scopes, with all permissions |
| read-only | Read everything except sensitive Dashboard settings |
| block-manager | RBD, RBD mirroring and iSCSI |
| rgw-manager | Object Gateway |
| cluster-manager | Hosts, OSDs, MON, MGR, configuration and logs |
| pool-manager | Pools |
| cephfs-manager | CephFS |
| ganesha-manager | NFS exports |
ceph dashboard ac-role-show
ceph dashboard ac-role-create storage-ops "Ops team: OSD and pool only"
ceph dashboard ac-role-add-scope-perms storage-ops osd read update
ceph dashboard ac-role-add-scope-perms storage-ops pool read create update
umask 077; openssl rand -base64 15 > /root/alice.pw
ceph dashboard ac-user-create --pwd_update_required alice -i /root/alice.pw storage-ops
shred -u /root/alice.pw     # after securely handing the temporary password to the user
ceph dashboard ac-user-set-roles alice storage-ops read-only
ceph dashboard ac-user-disable aliceDefine roles by duty, not by person. For example, the NOC team only needs read-only, the cloud platform team block-manager and the data team rgw-manager. Keep the administrator account for emergency operations and monitor its use.
9-5-2 Password policy and message of the day#
ceph dashboard set-pwd-policy-enabled true
ceph dashboard set-pwd-policy-min-length 12
ceph dashboard set-pwd-policy-check-complexity-enabled true
ceph dashboard motd set warning 2h "Maintenance on ceph-node3 in progress"
ceph dashboard motd clear
9-5-3 Single sign-on (SSO)#
The Dashboard supports SSO with SAML 2.0, and in recent releases, through oauth2-proxy and mgmt-gateway, it also supports OAuth2/OIDC. An important point: SSO only performs authentication; the user must also exist in the Dashboard (with the same user name) so that their role is known.
ceph dashboard sso setup saml2 https://ceph-dash.example.internal \
  /etc/ceph/idp-metadata.xml uid https://idp.example.internal/realms/infra
ceph dashboard sso status
ceph dashboard sso enable saml29-6 Tentacle: mgmt-gateway and oauth2-proxy#
In earlier releases, each management component (Dashboard, Grafana, Prometheus, Alertmanager) had its own address and port, and a change of active MGR changed the Dashboard's address. Tentacle introduced two cephadm services as the solution:
- mgmt-gateway: an nginx that is the single entry point to all management interfaces, terminates TLS and routes requests to the active MGR and the monitoring services. With a virtual IP it can be made multi-instance and highly available.
- oauth2-proxy: centralised authentication with an OIDC provider (such as Keycloak or the organisation's identity service) for all the interfaces behind the gateway.
ceph orch apply mgmt-gateway --placement="label:mgmt"
# with authentication and a virtual IP
ceph orch apply mgmt-gateway --virtual_ip 192.168.10.60 --enable-auth=true --placement="label:mgmt"
ceph orch ls mgmt-gatewayTentacle also added the certmgr service for centralised management of the TLS certificates of cephadm services. Before deploying mgmt-gateway in production, read the documentation of both services; especially the oauth2-proxy configuration (client id, secret and IdP address), which should go in a spec rather than on the command line so that secrets do not stay in the history.
9-7 Day-to-day work with the Dashboard#
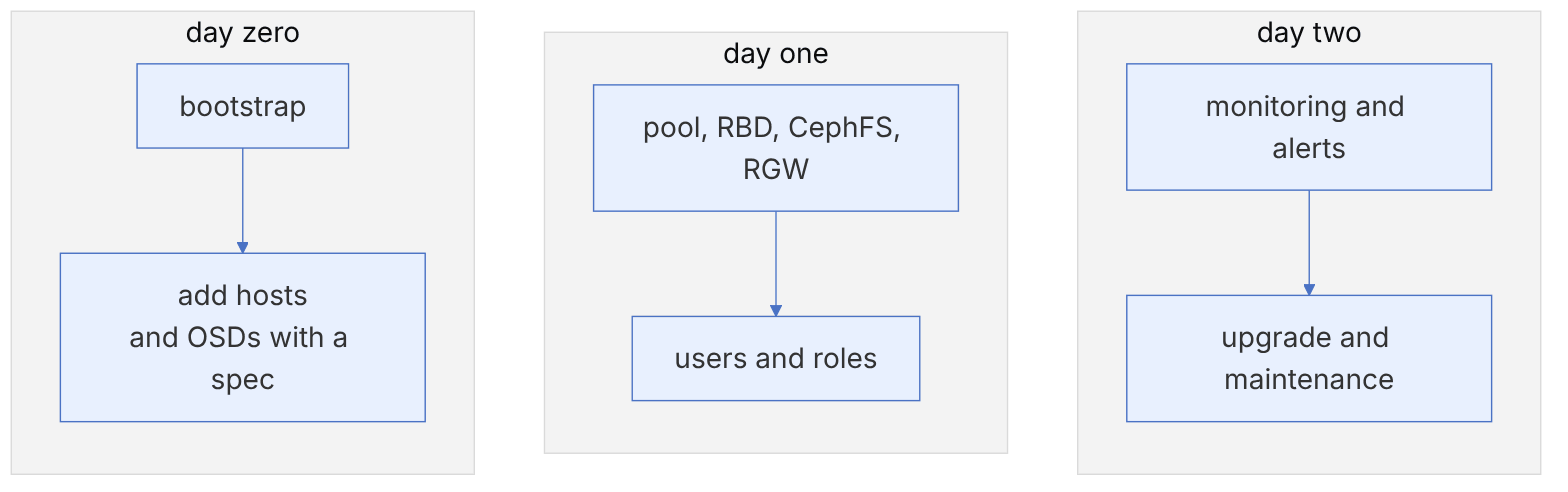
9-7-1 Day zero: building and expanding#
After bootstrap, the Dashboard's Expand Cluster page has a step-by-step guide to adding hosts, choosing disks for OSDs and deploying services. Behind the scenes it creates the same cephadm specs that you can see with ceph orch ls --export.
9-7-2 Day one: services#
From the Dashboard you can create and manage:
- pools (replicated and EC), with the autoscaler status shown;
- RBD images, snapshots, clones and mirroring;
- CephFS file systems, subvolumes, snapshots and NFS exports;
- RGW users and buckets, and the multisite configuration;
- NVMe/TCP gateways and their groups (Tentacle).
9-7-3 Day two: monitoring and maintenance#
- The home page shows health status, capacity, performance and active alerts.
- The OSDs page lets you change flags, set the device class, mark out/in and remove/replace.
- The Upgrade page shows the available releases and starts and tracks the cephadm upgrade.
- The cluster and audit logs (who ran which command) are available on the Logs page.
# the same operation through the REST API
TOKEN=$(curl -sk -X POST https://ceph-dash.example.internal:8443/api/auth \
  -H 'Accept: application/vnd.ceph.api.v1.0+json' -H 'Content-Type: application/json' \
  -d "{\"username\":\"apiuser\",\"password\":\"$(cat /root/apiuser.pw)\"}" | jq -r .token)
curl -sk https://ceph-dash.example.internal:8443/api/health/minimal \
-H 'Accept: application/vnd.ceph.api.v1.0+json' -H "Authorization: Bearer $TOKEN" | jq .healthThe Dashboard REST API replaces the old restful module, which was removed from the MGR in Tentacle. If your scripts or monitoring tools use restful, move them to the Dashboard API (or to Prometheus for metrics) before upgrading to Tentacle. For the API, use a separate user with the least role needed.
9-8 Step-by-step guide: a complete service from the Dashboard#
In this section we take a real scenario from start to finish with the Dashboard, and for each step we also give the equivalent CLI command so that you can check or automate the result. The scenario: the "data analytics" team needs a pool for RBD, a shared file system and an object bucket, and must have access only to its own resources.
9-8-1 Step 1: a pool with the autoscaler#
In the Cluster → Pools menu, click Create, choose type replicated, size 3, an SSD-based CRUSH rule and application rbd. The Dashboard leaves autoscaler mode on by default.
ceph osd pool create analytics-rbd --autoscale-mode=on
ceph osd pool set analytics-rbd crush_rule rep-ssd-host
ceph osd pool application enable analytics-rbd rbd
rbd pool init analytics-rbd
9-8-2 Step 2: an RBD image and user#
In Block → Images, create a 500 GB image with the default features (layering, exclusive-lock, object-map, fast-diff). The cephx user is not created in the Dashboard, but the Cluster → Users page (in recent releases) lets you view and create cephx users.
rbd create analytics-rbd/warehouse --size 500G
ceph auth get-or-create client.analytics mon 'profile rbd' osd 'profile rbd pool=analytics-rbd' mgr 'profile rbd pool=analytics-rbd'
9-8-3 Step 3: a subvolume in CephFS#
In File → File Systems, open the existing file system, go to the Subvolume groups tab, and create the group analytics and within it the subvolume shared with a 2 TB cap.
ceph fs subvolumegroup create fs01 analytics
ceph fs subvolume create fs01 shared --group_name analytics --size 2199023255552
ceph fs subvolume getpath fs01 shared --group_name analytics
9-8-4 Step 4: an object user and bucket#
In Object → Users, create the user analytics with a 10 TB quota; then in Object → Buckets create a bucket owned by this user with versioning enabled.
radosgw-admin user create --uid=analytics --display-name="Analytics team"
radosgw-admin quota set --quota-scope=user --uid=analytics --max-size=10T
radosgw-admin quota enable --quota-scope=user --uid=analyticsIn recent RGW releases the account concept (compatible with AWS IAM) is recommended for multi-tenancy, and the old tenants have been declared deprecated for IAM (chapter 4). The Dashboard has also been gradually adding account features; check the documentation page for your release before designing.
9-8-5 Step 5: a restricted role in the Dashboard#
Create a Dashboard role for the analytics team that only has read access to pools and RBD, so that they can see the usage and performance of their own resources. Note that Dashboard RBAC works at the scope level, not at the level of a specific pool; a user with the rbd-image scope sees the images of all pools.
This limitation is the main reason why full multi-tenant self-service should not be built on the Dashboard. To provide services to tenants, use a higher layer such as OpenStack (chapter 3), Kubernetes with Rook and ceph-csi, or an internal portal that works with a restricted API, and keep the Dashboard for operators.
9-8-6 Monitoring the team's resources#
After the resources are created, the pool and image detail pages show IOPS, throughput and latency charts (from Grafana). For these charts to have data at the image level, per-image RBD metrics collection must be enabled in the prometheus module:
ceph config set mgr mgr/prometheus/rbd_stats_pools "analytics-rbd"
ceph mgr module disable prometheus && ceph mgr module enable prometheusEnabling per-image stats for all pools in clusters with tens of thousands of images greatly increases the MGR load and the volume of Prometheus data. Add only the pools that really need per-image charts.
9-9 Side features of the Dashboard#
9-9-1 Turning sections on and off#
If you do not use some services, turn off the corresponding section so that the interface is simpler and users do not go looking for unused features:
ceph dashboard feature status
ceph dashboard feature disable iscsi mirroring
ceph dashboard feature enable mirroring
9-9-2 Telemetry#
The telemetry module sends anonymous reports about configuration and crashes to the Ceph project (with your explicit consent). The Dashboard shows a suggestion to enable it after installation. Before enabling it, look at the report contents and compare them with your organisation's privacy policy:
ceph telemetry preview         # preview the report while telemetry is off
ceph telemetry show            # the actual report while it is on
ceph telemetry on --license sharing-1-0
ceph telemetry offTelemetry data helps the development team see crashes and real usage patterns. If your environment is isolated or policy does not allow it, keep it off; no feature depends on it.
9-10 Inside the code: the ceph-mgr architecture and writing a module#
9-10-1 Process structure#
The Dashboard, Prometheus, balancer, pg_autoscaler, cephadm, volumes and dozens of other features are all Python modules inside a C++ process called ceph-mgr. The C++ part lives in src/mgr/, and its main files are MgrStandby.cc, Mgr.cc, DaemonServer.cc, ClusterState.cc, DaemonState.cc, PyModuleRegistry.cc, ActivePyModules.cc, StandbyPyModules.cc, PyModuleRunner.cc and BaseMgrModule.cc. The Python part is in src/pybind/mgr/, and the base API is in mgr_module.py.
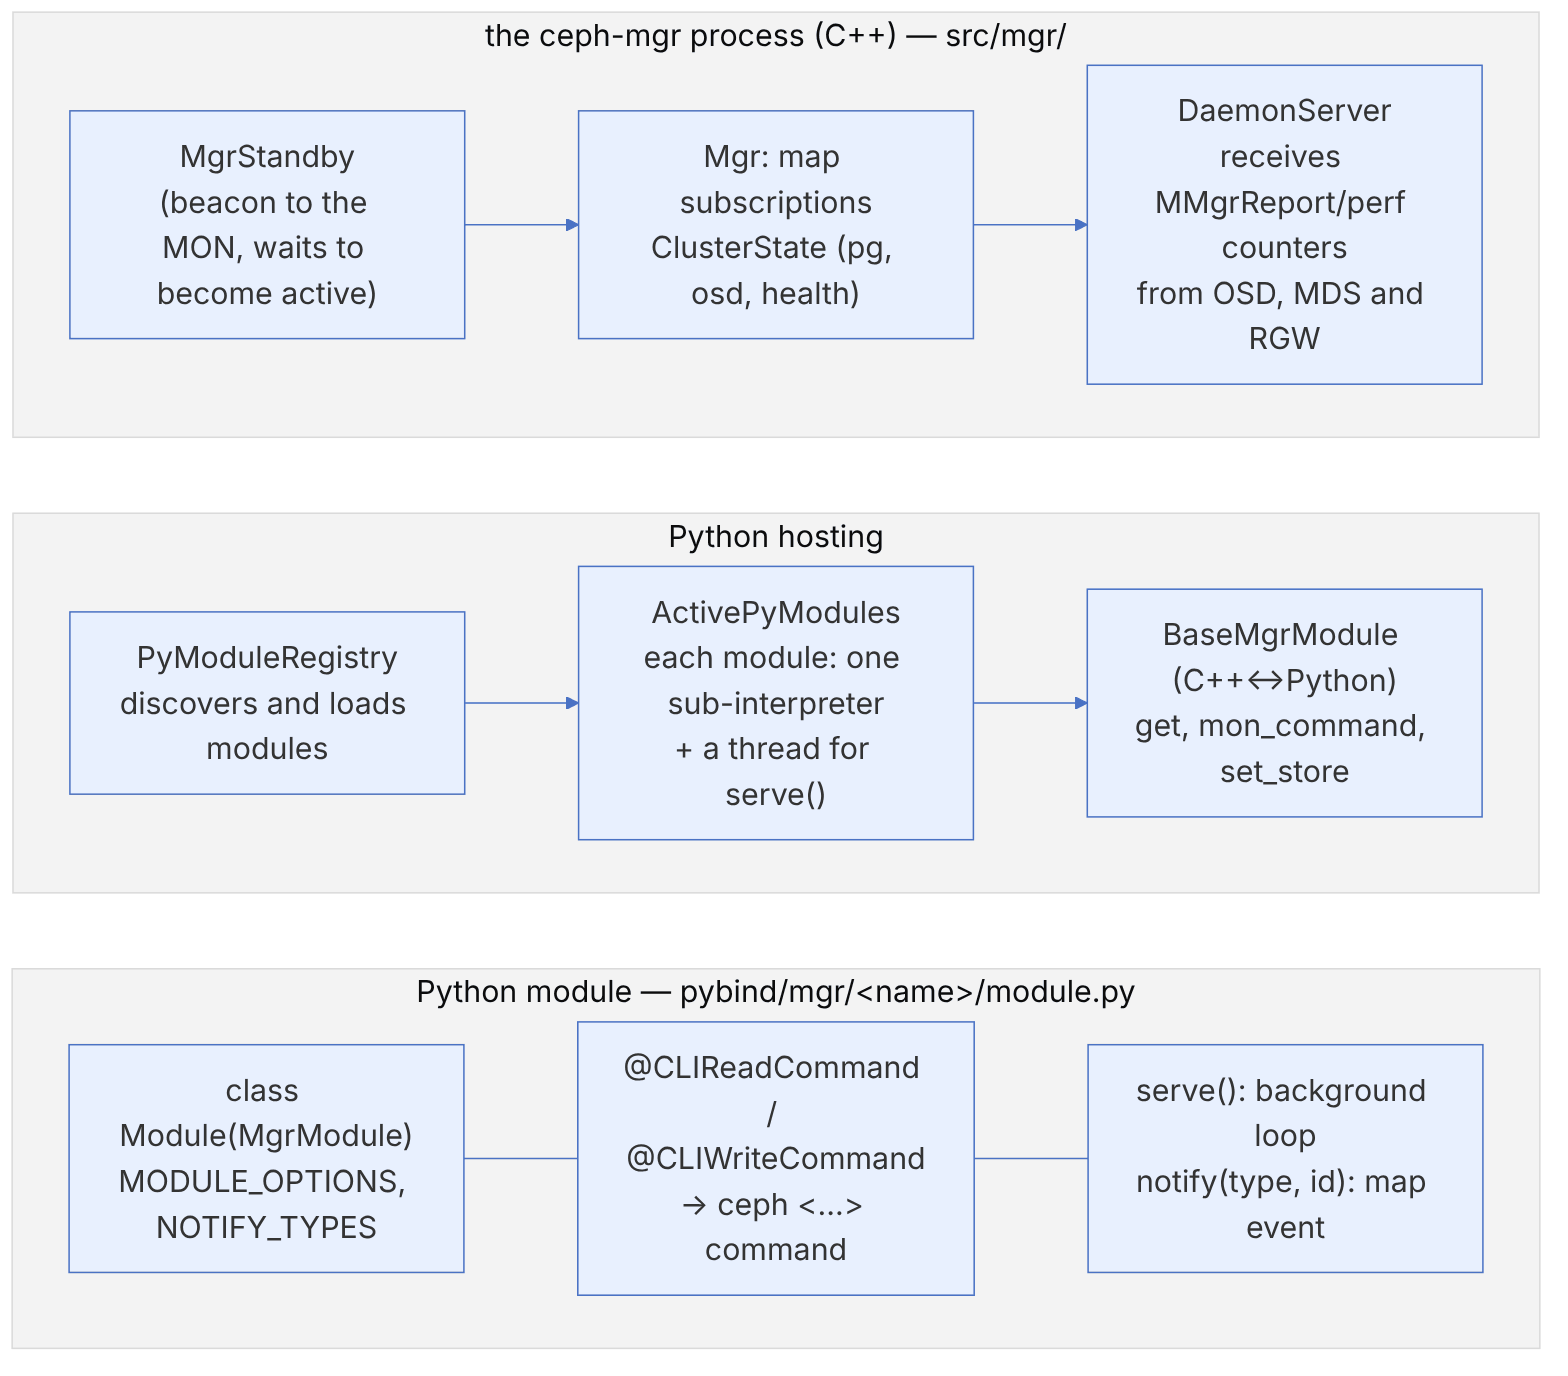
| API (mgr_module.py) | Use |
|---|---|
serve() / shutdown() | The module's background loop and clean stop |
notify(notify_type, notify_id) | Events requested in NOTIFY_TYPES; NotifyType includes mon_map, osd_map, fs_map, pg_summary, health, clog, command and more |
get(data_name) | Read maps from the C++ cache, such as osd_map, pg_summary and health |
mon_command(cmd_dict) | Run a MON command and return (retval, out, err) |
get_module_option / set_store / get_store | Module settings and key-value storage in config-key |
CLIReadCommand / CLIWriteCommand | Decorators that mgr_module.py maps to CLICommandBase.Read and CLICommandBase.Write |
9-10-2 A small module (this book's own code)#
This module adds the ceph pgwatch status command and monitors the number of unhealthy PGs in the background:
# pybind/mgr/pgwatch/module.py — a teaching example from this book
import threading
from mgr_module import MgrModule, CLIReadCommand, Option, NotifyType

class Module(MgrModule):
    MODULE_OPTIONS = [Option('interval', type='secs', default=30)]
    NOTIFY_TYPES = [NotifyType.pg_summary]

    def __init__(self, *args, **kwargs):
        super().__init__(*args, **kwargs)
        self._stop = threading.Event()
        self._last = {}

    def notify(self, notify_type, notify_id):
        if notify_type == NotifyType.pg_summary:
            self._last = self.get('pg_summary').get('all', {})

    @CLIReadCommand('pgwatch status')
    def status(self):
        """Show PG state counts seen by pgwatch"""
        bad = {k: v for k, v in self._last.items() if k != 'active+clean'}
        return 0, str(bad or 'all active+clean'), ''

    def serve(self):
        while not self._stop.wait(self.get_module_option('interval')):
            self.log.debug('pgwatch tick: %s', self._last)

    def shutdown(self):
self._stop.set()A slow or stuck module (for example serve without a wait, or heavy get('pg_dump') calls in a large cluster) slows down the whole mgr and may cause lost beacons and a failover. Check the MGR_MODULE_ERROR warning and the ceph mgr module ls command, and raise debug_mgr to 20 for troubleshooting.
Commands:
ceph mgr module ls | jq '.enabled_modules'
ceph mgr module enable pgwatch --force     # a module outside the official list
ceph pgwatch status
ceph config set mgr mgr/pgwatch/interval 10
ceph mgr fail                               # failover to a standby
ceph tell mgr.$(ceph mgr stat | jq -r .active_name) config set debug_mgr 209-11 Three Dashboard security algorithms by the numbers#
The Dashboard code is Python and runs in the ceph-mgr process. Its three security mechanisms are simple, but their details produce behaviours the operator should know. The paths below are from the v21.2.0 tag.
9-11-1 The password complexity score#
Source in code: src/pybind/mgr/dashboard/services/access_control.py :: PasswordPolicy.check_all, check_password_complexity, check_if_sequential_characters, check_if_repetitive_characters; src/pybind/mgr/dashboard/settings.py :: PWD_POLICY_*
Complexity: O(n) for an n-character password; the forbidden word list with one regex
pseudocode
if !PWD_POLICY_ENABLED: accept
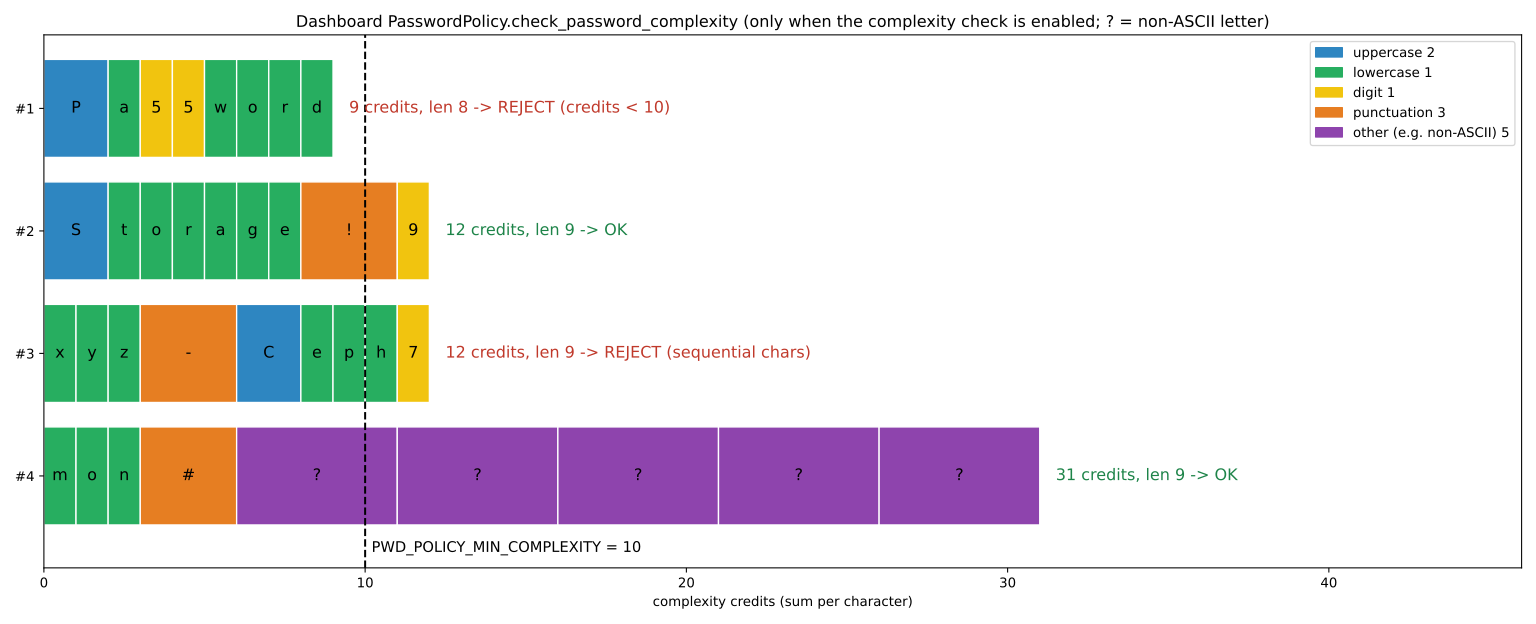
credits = Σ (upper 2 , lower 1 , digit 1 , symbol 3 , other 5)   # only if complexity is enabled, otherwise = 10
if credits < MIN_COMPLEXITY (10) or len < MIN_LENGTH (8): "weak"
if == previous password (enabled by default) ; contains the user name ; contains a forbidden word: reject
if three identical consecutive characters (aaa) or three ascending consecutive codes (abc, 123): reject
Numerical example (with complexity, sequential and repetitive enabled).
Pa55word: P = 2, a = 1, two digits = 2 and four lower-case letters = 4, total 9 < 10. Rejected, even though it has 8 characters.Storage!9: the total is 12 and it is accepted.xyz-Ceph7: it has 12 credits, but x, y and z are ascending consecutive codes, so it is rejected.mon#followed by five Persian letters: each non-ASCII letter is worth 5 credits, so the total is 31.
The sequence check is ascending only. cba is not rejected. The default forbidden word list includes osd, host, dashboard, pool, block, nfs, ceph, monitors, gateway, logs, crush and maps. Because the search is case-insensitive, Ceph2026 is rejected by this check. An important point: in the defaults, of these checks only the length and the previous-password repetition are enabled.
9-11-2 Authorising a REST request#
Source in code: src/pybind/mgr/dashboard/services/auth/auth.py :: AuthManagerTool._check_authorization, JwtManager.gen_token, JwtManager.get_user; src/pybind/mgr/dashboard/services/access_control.py :: User.authorize, Role.authorize; src/pybind/mgr/dashboard/controllers/_rest_controller.py :: _permission_map
Complexity: O(R × P) for R user roles and P requested permissions
pseudocode
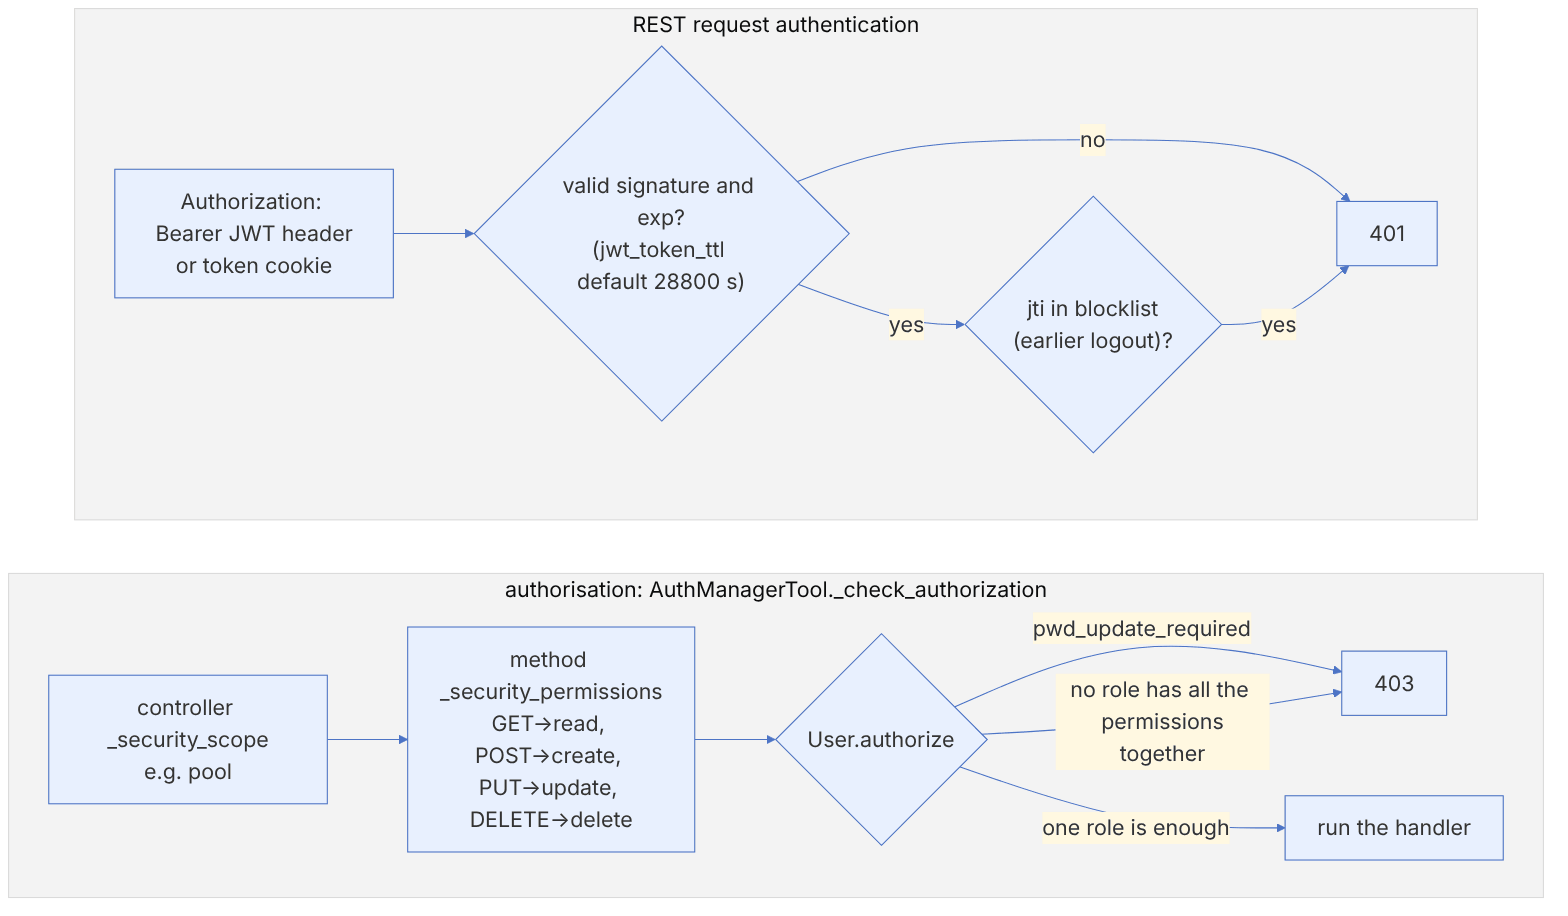
token = JWT{iss: ceph-dashboard, jti: uuid4, iat: now, exp: now + jwt_token_ttl (28800 s)}
request: verify signature and exp ; jti in blocklist ⇒ 401
scope = controller._security_scope ; perms = handler._security_permissions (GET→read …)
if scope undefined: open ; if perms empty: 403
User.authorize: if pwd_update_required: false
    for role in roles: if role.scopes[scope] ⊇ perms: true     # all from one role
    false ⇒ 403
Numerical example. A user has two roles: A with pool: [read] and B with pool: [update].
GET /api/pool: needs read and role A is enough, so 200.PUT /api/pool/rbd: needs update and role B is enough, so 200.- An endpoint that requires
[read, update]at once: no role has both, so 403. Meanwhilepermissions_dict, used for display in the UI, shows the union of permissions, and you see both permissions.
If the administrator has turned on pwd_update_required for the user, all endpoints with a scope return 403 until the password is changed. A token is valid for 8 hours. ceph dashboard set-jwt-token-ttl 3600 reduces it to one hour.
9-11-3 Account lockout after failed attempts#
Source in code: src/pybind/mgr/dashboard/controllers/auth.py :: Auth.create; src/pybind/mgr/dashboard/services/access_control.py :: AccessControlDB.increment_attempt, reset_attempt, get_attempt
Complexity: O(1) per attempt; the counter is stored in the Dashboard user database (KV in the MON)
pseudocode
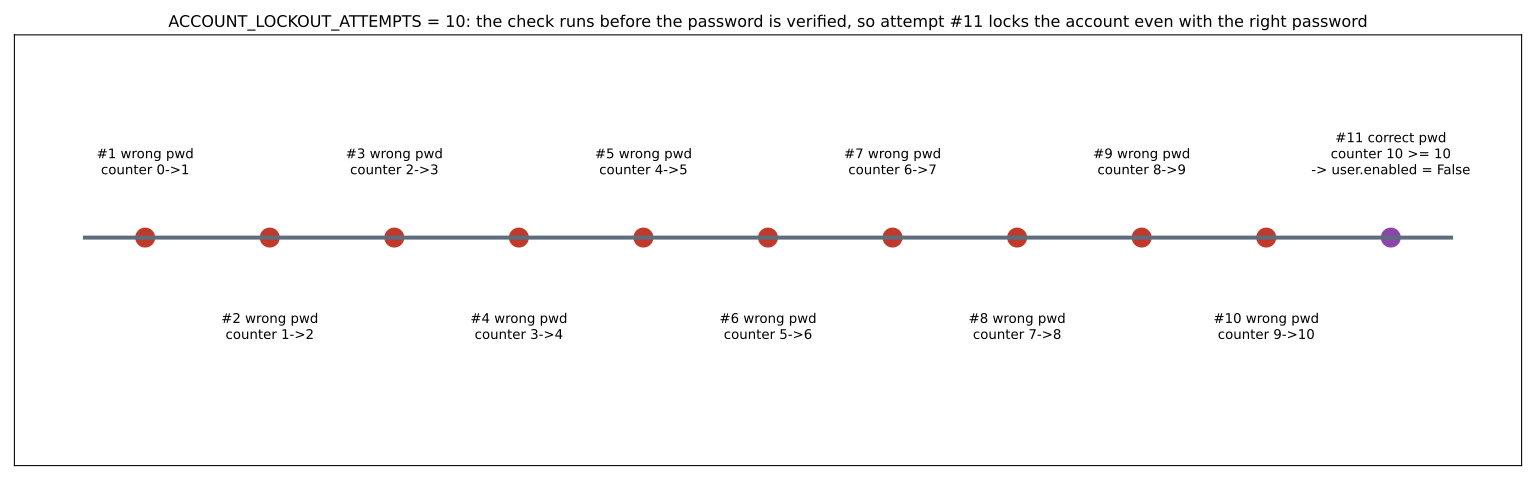
max = ACCOUNT_LOCKOUT_ATTEMPTS (10)
if max == 0 or attempts(user) < max:
    if password correct: reset_attempt ; issue token
    else: increment_attempt ; InvalidCredentialsError
else: user.enabled = false ; warning "account was blocked"     # before checking the password!
unlock: ceph dashboard ac-user-enable <user>   (also does reset_attempt)
Numerical example. Ten attempts with a wrong password take the counter from 0 to 10. The eleventh attempt, even with the right password, goes to the else branch, because 10 < 10 does not hold. So the account is disabled. A successful login at any point before that resets the counter. That is, 9 errors, one correct login and another 9 errors do not lock the account. Because the counter is per user name, an attacker can deliberately lock the admin account. So having a second administrator account or CLI access for ac-user-enable is essential. ceph dashboard set-account-lockout-attempts 0 turns lockout off completely and is not recommended.
9-12 How fresh is the Dashboard, and what does looking at it cost?#
Everything the Dashboard (and ceph -s, ceph df and the prometheus module) shows is read from ceph-mgr's memory. The mgr itself builds this data from the OSDs' periodic reports. The two experiments below were run on a three-OSD test cluster with Ceph 18.2.7, and both answer a practical question: how many seconds old is the number you see, and what does repeatedly querying the mgr cost?
9-12-1 Stats delay: mgr_stats_period#
The mgr_stats_period option, default 5 seconds (src/common/options/mgr.yaml.in), determines how often OSDs and MDSs send their stats to the mgr. The mgr announces this period to the daemons through the MMgrConfigure message.
Source in code: measurement; mgr_stats_period in src/common/options/mgr.yaml.in
Complexity: O(period) per sample
pseudocode
for each period p in {1, 2, 5, 10}:
  ceph config set global mgr_stats_period p ; wait 2p+2 seconds
  15 times: wait random U(0, p) ; b = num_objects from "pg dump pools"
          write_full(new object) ; t0 = now
          while num_objects ≤ b: ask again every 50 milliseconds
          lag = now − t0
Result. With a 1-second period, the delay was between 1.0 and 1.9 seconds. With a 2-second period between 2.2 and 3.9, with the default 5-second period between 1.4 and 6.5 (median about 4.2), and with a 10-second period between 1.5 and 9.7 seconds.
So with the default setting, the object count and pool usage in the Dashboard lag reality by up to about six seconds. During this time, a new write or a pool filling up is not visible. Reducing this period improves freshness, but in a large cluster it increases the message processing load on the mgr. The option's own description mentions exactly this trade-off.
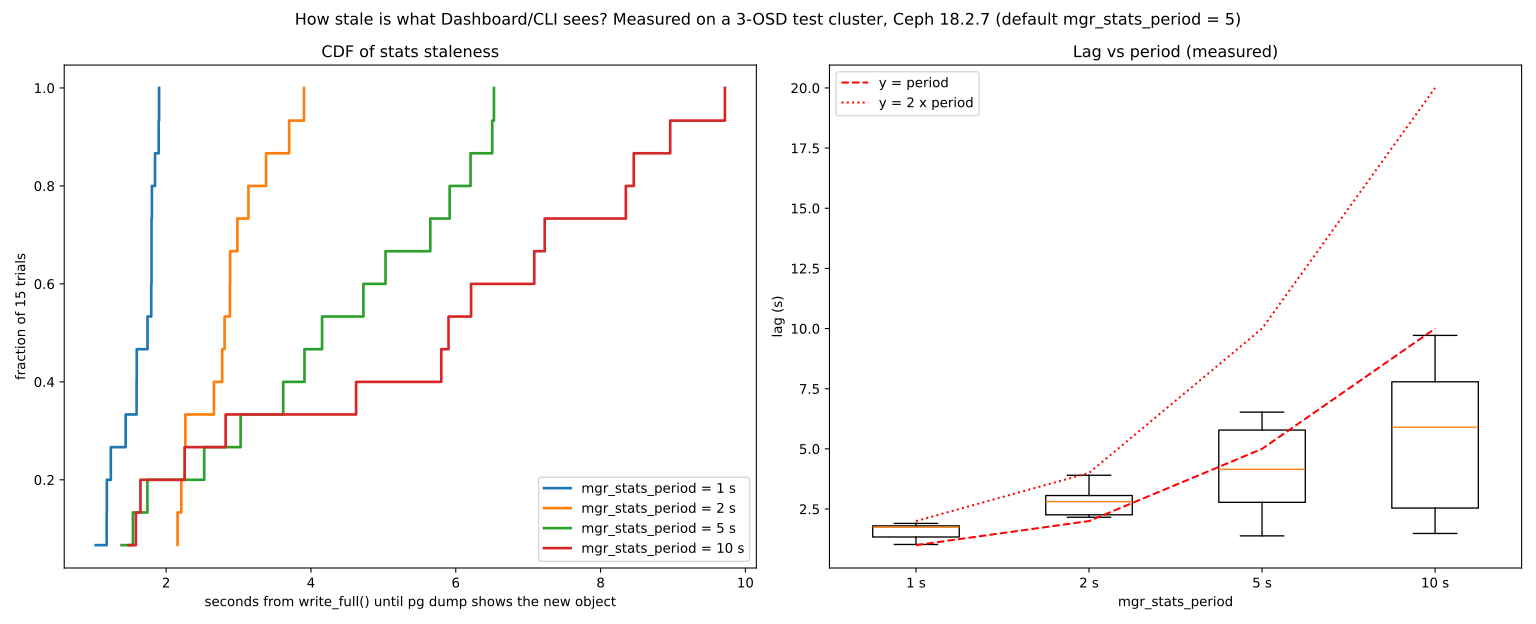
pg dump shows it, for four values of mgr_stats_period. Left: the cumulative distribution of 15 trials. Right: a box plot with the lines y = p and y = 2p. Measured on Ceph 18.2.79-12-2 Query cost: pg dump versus status#
Source in code: measurement; mgr_command('pg dump') and mon_command('status')
Complexity: O(number of PGs) for pg dump and O(1) for status
pseudocode
for PG count in {32, 128, 512, 1024}:   # by creating a temporary pool p09 and waiting for active+clean
  for each command in {pg dump (full), pg dump pgs_brief, status}:
     run 10 times ← median time and JSON response size
Result. The full pg dump response is about 2.4 KiB per PG: with 1024 PGs it was 2.49 MB and took 25.8 milliseconds. The pgs_brief version was about 96 bytes per PG: 98 KB and 2.1 milliseconds. The status response stayed around 1.7 KB in every case, and its time was under 0.25 milliseconds.
If we extend the linear growth (extrapolation, not measurement), a cluster with 100 thousand PGs produces about 240 MB of JSON per full pg dump. A monitoring script that calls it every few seconds keeps the mgr effectively busy serialising JSON. This is the same single-threaded mgr that the Dashboard and prometheus also depend on.
A practical rule: for monitoring, use status, pg stat or prometheus metrics. If you need the PG list, ask for pgs_brief. Run a full pg dump only for one-off troubleshooting.
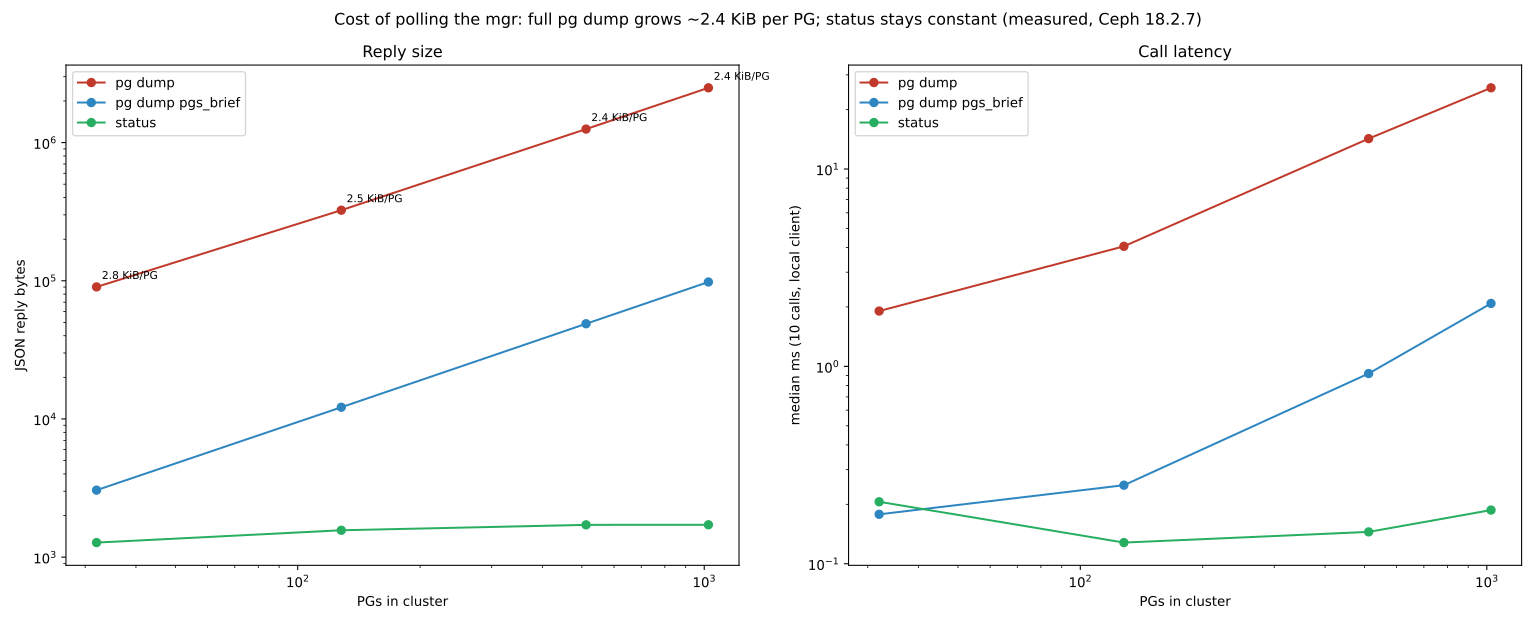
pg dump, pg dump pgs_brief and status in clusters with 32 to 1024 PGs. Measured on Ceph 18.2.79-13 The Dashboard's place in operations#
9-13-1 Graphical interface, CLI or GitOps?#
| Method | Strength | Weakness |
|---|---|---|
| Dashboard | Quick overview, feature discovery, suitable for less technical users and the NOC | Changes are not easily documented and reviewed |
CLI (ceph, ceph orch) | Precise, scriptable, available in all conditions | Needs more knowledge; a typo is costly |
| GitOps (cephadm specs or Rook CRDs in Git) | Review, history and reversibility | Needs initial set-up and team discipline |
A balanced working pattern:
- The desired state (services, OSD specs, main pools) is kept in Git and applied with review.
- Daily and emergency operations are done with the CLI and recorded in a ticket or operations log.
- The Dashboard is used for viewing, monitoring, training and limited self-service tasks (for example teams creating buckets or images with a restricted role).
The cluster audit log (ceph log last 50 info audit) records all administrative commands, whether from the CLI or the Dashboard, with the user name. Send this log to the organisation's centralised logging system so that you can find out who changed what and when.
9-13-2 When the Dashboard is unavailable#
The Dashboard depends on the MGR, and the MGR on the MONs. In the worst crises (losing quorum, stuck MGRs) the Dashboard is the first thing to become unavailable. Therefore:
- The team must have practised the critical procedures with the CLI.
- The main monitoring (Prometheus and Alertmanager) must work independently of the Dashboard, and alerts must be sent through a separate path.
- Emergency SSH access to the MON nodes and
cephadm shellmust be documented.
ceph mgr stat
ceph mgr fail                         # switch the active MGR if the Dashboard does not respond
ceph mgr module disable dashboard && ceph mgr module enable dashboard
ceph log last 20 info clusterIf the Dashboard opens but some sections are empty: the host and service sections need the orchestrator (ceph orch status), the charts need Grafana (ceph dashboard get-grafana-api-url) and the alerts need Alertmanager. The RGW section is empty when the Dashboard cannot find the RGW credentials; ceph dashboard set-rgw-credentials sets them.
- VSM is archived; do not use it.
- Make the Dashboard reachable only from the management network and with a valid certificate.
- Roles by duty; administrator only for emergencies.
- Passwords from a file, not the command line; password policy enabled.
- In Tentacle, mgmt-gateway and oauth2-proxy for a single entry point and SSO.
- restful has been removed; use the Dashboard API.
- Take the Dashboard's dependence on the MGR into account when designing monitoring and emergency procedures.
9-14 Supplementary and up to date#
- VSM: repository archived, last release v2.2.0 (July 2016).
- Dashboard: the first, read-only version in Luminous; the full version based on openATTIC.
- Tentacle: the mgmt-gateway, oauth2-proxy and certmgr services in cephadm; removal of the restful module; Dashboard support for NVMe/TCP gateway groups.
- Versioned API: requests specify the API version with the header
Accept: application/vnd.ceph.api.v1.0+json, so that Ceph upgrades do not break scripts.
9-15 Hands-on exercise#
- 1. Find the Dashboard address with
ceph mgr servicesand log in with the self-signed certificate. Then replace the certificate with one issued by a test CA. - 2. Create a role called
storage-opswith access to osd and pool, create a user with this role and check that the RGW section is not available to them. - 3. Enable a password policy with a minimum length of 12 and try creating a user with a short password.
- 4. Get a token through the REST API and read the health status from
/api/health/minimal. - 5. Switch the active MGR with
ceph mgr failand watch the Dashboard address change. Then setstandby_behaviourtoerrorand check the standby MGR's behaviour. - 6. In a Tentacle or Umbrella test cluster, deploy mgmt-gateway and test access to Grafana and the Dashboard from a single address.
9-16 Review questions#
- 1. Why is VSM not a suitable option today?
- 2. Which of VSM's ideas have continued in today's Ceph, and in what form?
- 3. Why is the Dashboard served only by the active MGR, and what consequence does this have?
- 4. What is the orchestrator's role in the Dashboard?
- 5. Why do we read the password from a file with
-i? - 6. What is the difference between a role and a scope in Dashboard RBAC?
- 7. Why is SSO alone not enough for access?
- 8. What problem does mgmt-gateway solve?
- 9. After the removal of the restful module, what replacement is there for automation?
- 10. Why should the cluster's main monitoring not depend only on the Dashboard?
Answers to these questions are in Appendix E: Answers to Review Questions. Answers to this chapter's questions →
9-17 Sources for this chapter#
- Ceph Dashboard
https://docs.ceph.com/en/latest/mgr/dashboard/ - Ceph RESTful API (Dashboard API
https://docs.ceph.com/en/latest/mgr/ceph_api/ - Management gateway
https://docs.ceph.com/en/latest/cephadm/services/mgmt-gateway/ - OAuth2 proxy service
https://docs.ceph.com/en/latest/cephadm/services/oauth2-proxy/ - Monitoring services (cephadm
https://docs.ceph.com/en/latest/cephadm/services/monitoring/ - Ceph Manager daemon
https://docs.ceph.com/en/latest/mgr/ - Tentacle release notes
https://docs.ceph.com/en/latest/releases/tentacle/ - Intel VSM (archived
https://github.com/intel/virtual-storage-manager