Benchmarking and Expert Tools for Ceph
TL;DR this chapter in a few lines
- Measure layer by layer: disks with fio, the network, then RADOS, RBD, RGW and CephFS, so you know where a disappointing number comes from.
ceph tell osd.N benchtests one OSD's BlueStore without network or replication;rados benchtests the whole cluster path. They are not comparable.- fio's rbd engine, warp for S3 and the admin socket (
perf dump,dump_historic_ops) are the operator's main tools. - A benchmark report without hardware, versions, settings, duration and percentiles is worthless.
10-1 Before you start#
10-1-1 What questions does this chapter answer?#
"How fast is our cluster?" is a question every Ceph team eventually faces, and the right answer is almost never a single number. This chapter teaches how to measure performance from the lowest layer (disk and network) up to the interfaces, and then turns to the expert operator's toolbox: the admin socket, ceph tell, the management API, memory profiling and ceph-objectstore-tool. The old outline also included a few tools that have since been dropped (ceph-medic, the restful module, "experimental" BlueStore); we clarify their status too.
- Why should measurement be done layer by layer?
- How do we take a baseline of disks and network?
- How do we run and interpret
rados bench,rbd benchand fio correctly? - How do the admin socket and
ceph telldiffer, and what information do they give? - How do we examine daemons' memory usage?
- When is
ceph-objectstore-toola rescue tool, and when is it dangerous?
10-2 Layered measurement#
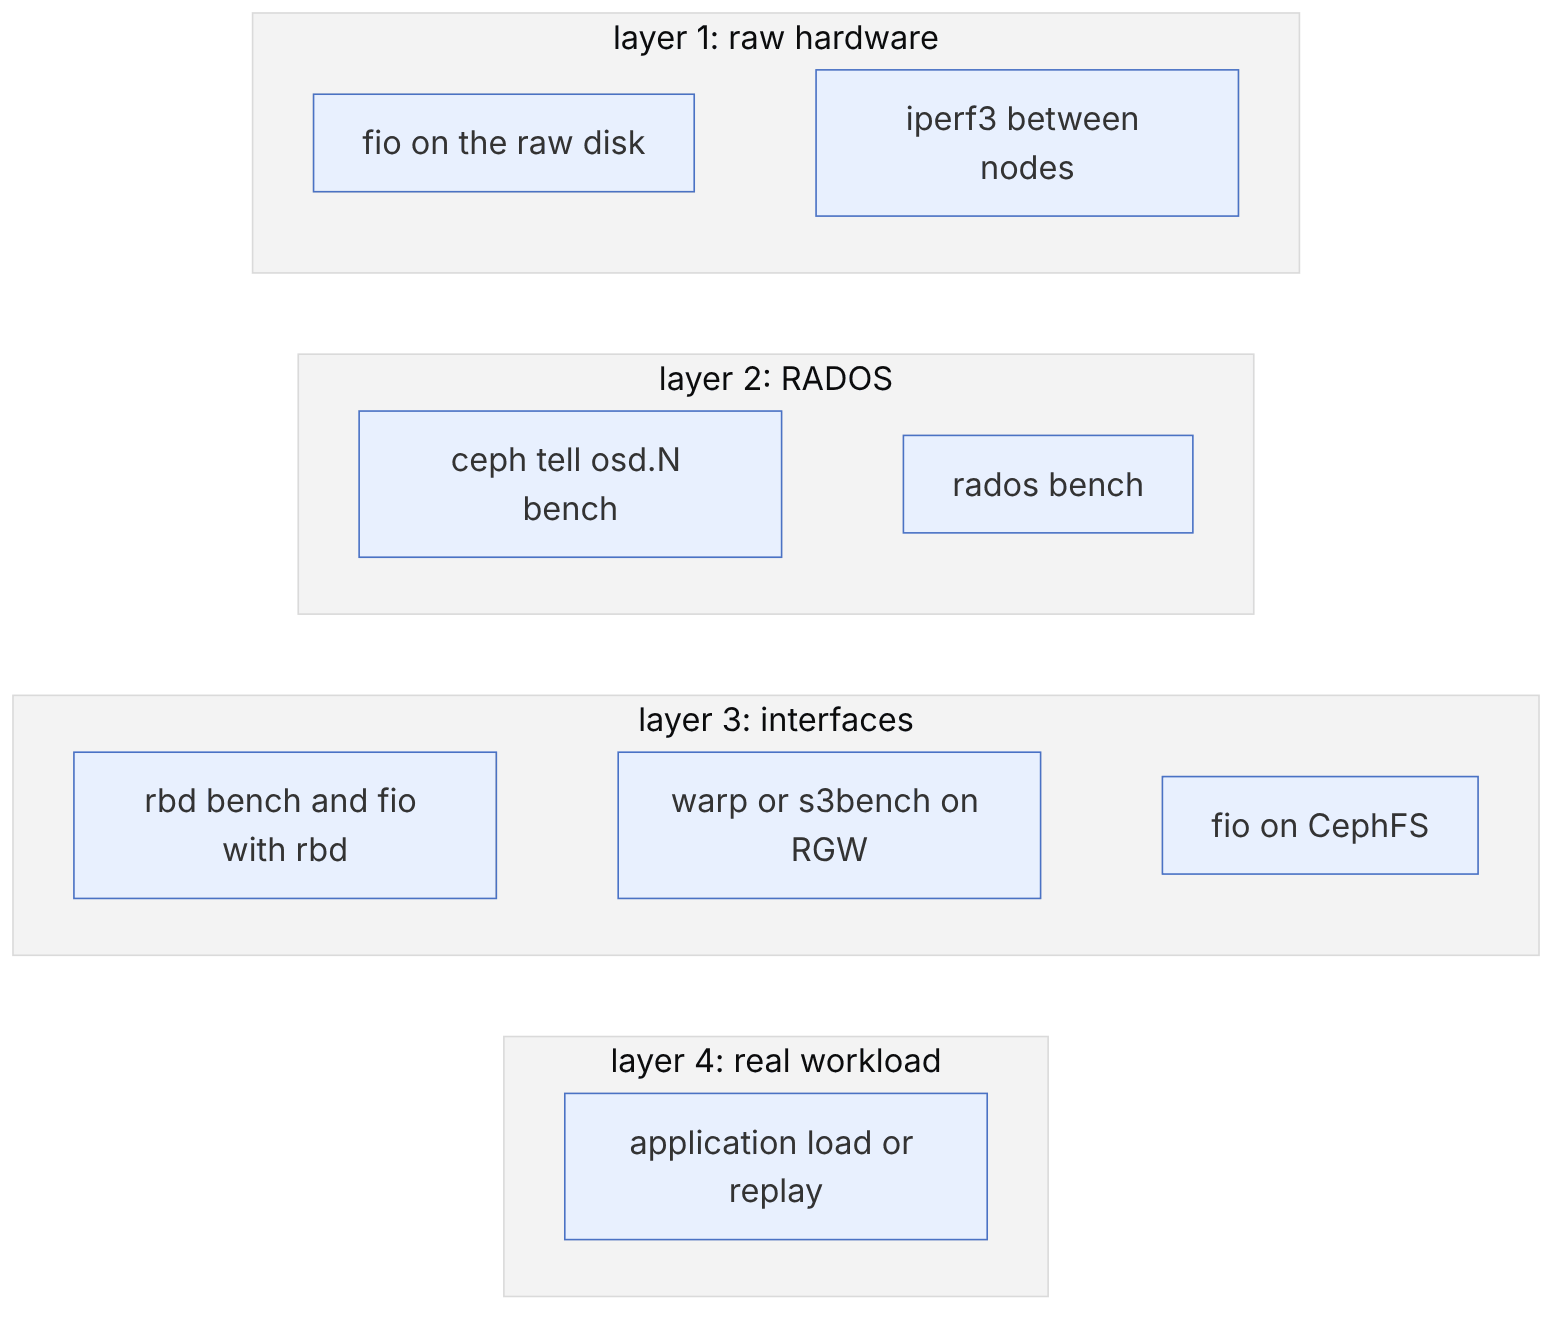
If rbd bench gives a disappointing number, you do not know whether the problem is the disk, the network, the OSD configuration or the client. But if you know how many IOPS each disk gives and how many gigabits the network carries, you can compute the theoretical ceiling and see where the gap appears. The general rule:
- 1. Measure the ceiling of each disk and each network link separately.
- 2. Compute the cluster's theoretical ceiling (taking the replication factor or EC into account).
- 3. Measure RADOS directly.
- 4. Measure the interfaces (RBD, RGW, CephFS).
- 5. Test the application's real workload.
Never interpret a read benchmark right after writing the same data: the client OS page cache, the RBD client cache and the BlueStore cache make the numbers unrealistic. Also, do not run heavy benchmarks on a cluster holding production data; a write benchmark can raise latency for every tenant.
10-3 Hardware baseline#
10-3-1 Disk#
The right tool for measuring disks is fio; dd measures only a simple sequential pattern and does not control queue depth. Run the tests below on a disk that is not yet an OSD, because writing directly to the raw disk destroys its data.
# large-block sequential write (throughput)
sudo fio --name=seqwrite --filename=/dev/sdX --rw=write --bs=4M --direct=1 \
  --ioengine=libaio --iodepth=16 --runtime=60 --time_based --group_reporting
# small-block random write with sync (close to WAL behaviour)
sudo fio --name=syncwrite --filename=/dev/sdX --rw=randwrite --bs=4k --direct=1 \
  --sync=1 --ioengine=libaio --iodepth=1 --numjobs=1 --runtime=60 --time_based
# random read
sudo fio --name=randread --filename=/dev/sdX --rw=randread --bs=4k --direct=1 \
--ioengine=libaio --iodepth=32 --runtime=60 --time_basedThe second test (4 KB writes with sync at queue depth 1) is the most important test for SSDs that are to be DB/WAL devices or OSDs. Consumer SSDs without power-loss protection (PLP) sometimes give only a few hundred IOPS in this test, while datacenter SSDs with PLP give tens of thousands. The reason is that an SSD without PLP must really put every sync write on NAND. This difference shows up directly in Ceph's write latency.
10-3-2 Running on several disks at once#
To find a controller or bus bottleneck, run the same test simultaneously on all the disks of a node and compare the total with the number of disks times the single-disk figure. If the total is much lower, the HBA controller, expander or PCIe is the bottleneck.
sudo fio --rw=write --bs=4M --direct=1 --ioengine=libaio --iodepth=16 --runtime=60 --time_based --group_reporting \
  --name=d1 --filename=/dev/sdb --name=d2 --filename=/dev/sdc --name=d3 --filename=/dev/sdd
10-3-3 Network#
# on node 1
iperf3 -s
# on node 2: several parallel streams, because one TCP stream usually does not fill a 25 or 100 Gbit link
iperf3 -c ceph-node1 -P 8 -t 30
# check MTU and jumbo frames end to end
ping -M do -s 8972 -c 3 ceph-node1A mismatched MTU (for example 9000 on the nodes and 1500 on one switch) is one of the most common causes of strange Ceph behaviour: small heartbeats get through and OSDs look up, but large messages are lost and operations become slow or hang. Run the ping -M do test between every pair of nodes and on both the public and cluster networks.
10-3-4 The theoretical ceiling#
With the baseline numbers you can compute an approximate ceiling. For example, with 6 nodes, each with 10 SSDs of 1.5 GB/s sequential write each, and a 25 Gbit network (about 3 GB/s) per node:
- Disks: 6 × 10 × 1.5 = 90 GB/s raw write.
- With three-way replication each user byte is written three times: about 30 GB/s.
- But each node's network is only 3 GB/s, and every incoming byte travels over the network twice more to the secondaries; so the network is the bottleneck and the real ceiling is far below 30.
This kind of calculation shows that the next investment should be in the network, not the disks.
10-4 Measuring RADOS#
10-4-1 Single-OSD benchmark#
Each OSD has a built-in benchmark that writes directly to that OSD's BlueStore (no network or replication). It is useful for finding slow OSDs among hundreds:
ceph tell osd.0 bench                       # default: 1 GB with 4 MB blocks
ceph tell osd.0 bench 12288000 4096 4194304 100   # total bytes, block size, object size, number of objects
for i in $(ceph osd ls); do echo -n "osd.$i "; ceph tell osd.$i bench -f json | jq -r .bytes_per_sec; done | sort -nk2 | head
10-4-2 rados bench#
rados bench sends load directly to a pool and measures the full RADOS path (network, replication, commit). Create a separate pool so that test data does not mix with real data:
ceph osd pool create benchpool 128 128
ceph osd pool application enable benchpool rados-bench --yes-i-really-mean-it
rados bench -p benchpool 60 write -b 4M -t 16 --no-cleanup
rados bench -p benchpool 60 seq -t 16
rados bench -p benchpool 60 rand -t 16
rados bench -p benchpool 60 write -b 4K -t 64 --no-cleanup     # small-block IOPS
rados -p benchpool cleanupThe rados bench result includes average throughput, IOPS and latency (mean, maximum and standard deviation). A high latency standard deviation or a very large "maximum" indicates one or more slow OSDs, even if the mean looks good. Sequential and random reads must be run from the same host that did the writes, because the object names include the host name. To simulate several clients, run several instances at once from several hosts with different --run-name values.
rados load-gen, which appears in older sources, is not seen in the current rados manual page. For mixed workloads today, use fio with the rados or rbd engine, which gives much more control over the load pattern.
10-5 Measuring RBD#
10-5-1 rbd bench#
rbd create rbd/benchimg --size 100G
rbd bench --io-type write --io-size 4K --io-threads 32 --io-total 10G --io-pattern rand rbd/benchimg
rbd bench --io-type read --io-size 4K --io-threads 32 --io-total 10G --io-pattern rand rbd/benchimg
rbd bench --io-type readwrite --rw-mix-read 70 --io-size 16K --io-pattern rand rbd/benchimg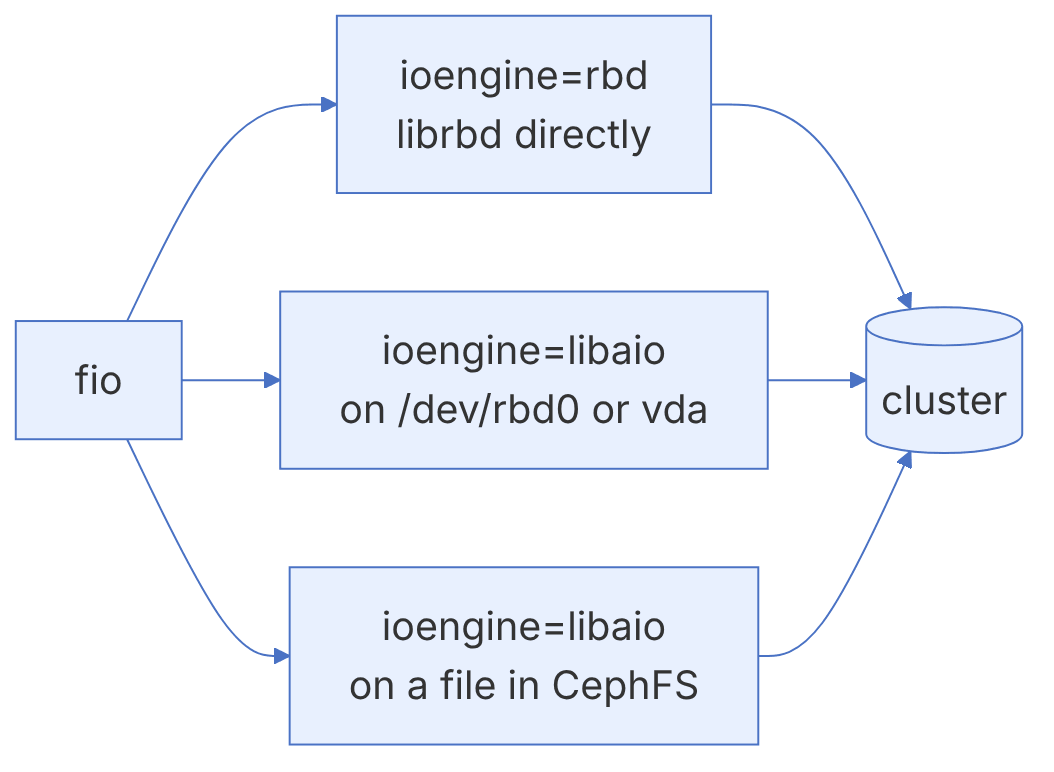
10-5-2 fio with the rbd engine#
fio has an rbd engine that uses librbd directly, with no need for rbd map or a virtual machine. This method is ideal for comparing configurations:
# rbd-randwrite.fio
[global]
ioengine=rbd
clientname=admin
pool=rbd
rbdname=benchimg
direct=1
time_based=1
runtime=120
ramp_time=15
group_reporting=1

[randwrite-4k]
rw=randwrite
bs=4k
iodepth=32
numjobs=4

[randread-4k]
stonewall
rw=randread
bs=4k
iodepth=32
numjobs=4fio rbd-randwrite.fio --output-format=json > result.json
jq '.jobs[] | {name: .jobname, write_iops: .write.iops, read_iops: .read.iops, p99_us: (.write.clat_ns.percentile."99.000000" // .read.clat_ns.percentile."99.000000")/1000}' result.jsonFor a measurement close to reality, also run fio inside a virtual machine on that machine's RBD disk. The difference between fio with the rbd engine and fio inside the VM shows the overhead of the virtualisation layer (virtio, QEMU, cache). Always report the 99th and 99.9th latency percentiles, not just mean IOPS; databases are sensitive to the tail of the latency distribution.
10-5-3 Pre-warming the image#
The first write to each part of a new image is slower, because RADOS objects must be created. Before measuring random writes, fill the image once with a full sequential write; otherwise the measured number is a mix of "object creation" and "overwrite".
10-6 The operator's toolbox#
10-6-1 The admin socket and ceph tell#
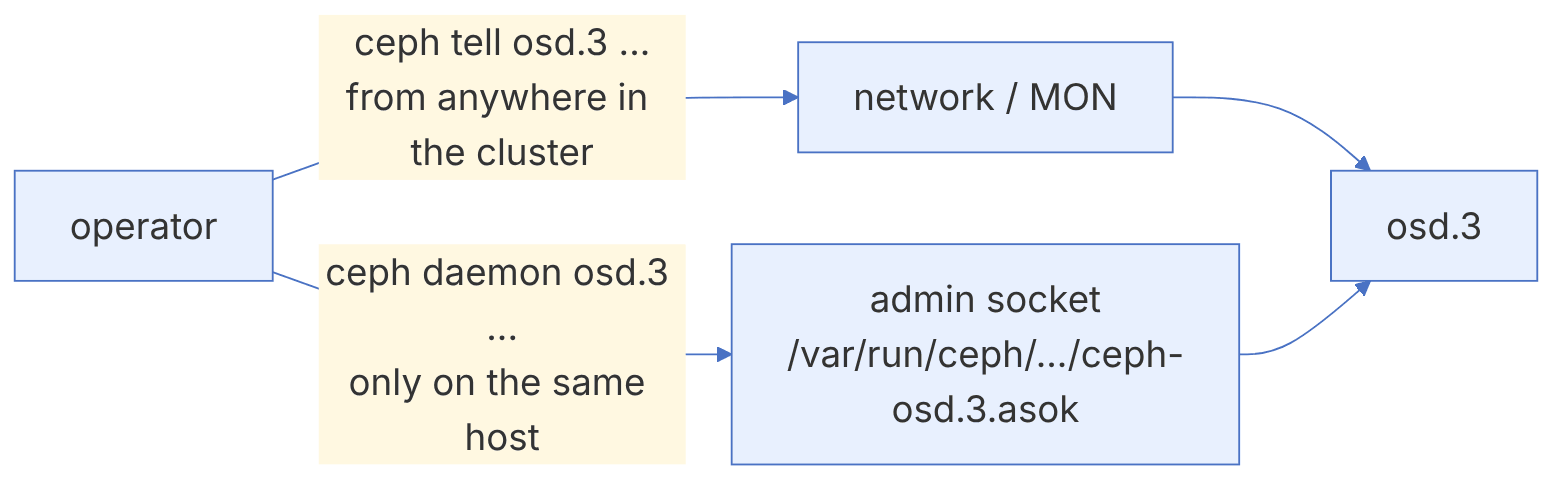
Each daemon has an admin socket (a Unix socket file) that answers diagnostic commands without needing the MON or the network. In cephadm the sockets live under /var/run/ceph/<fsid>/, and the simplest way to use them is cephadm shell --name:
cephadm shell --name osd.3 -- ceph daemon osd.3 help
cephadm shell --name osd.3 -- ceph daemon osd.3 dump_ops_in_flight
cephadm shell --name osd.3 -- ceph daemon osd.3 dump_historic_ops
cephadm shell --name osd.3 -- ceph daemon osd.3 perf dump bluestore
cephadm shell --name osd.3 -- ceph daemon osd.3 config diff
Many of the same commands are also available from anywhere in the cluster with ceph tell:
ceph tell osd.3 dump_ops_in_flight
ceph tell osd.3 dump_historic_slow_ops
ceph tell osd.* version
ceph tell mon.* sessions | jq length
ceph tell mds.fs01:0 perf dump| Command | Use |
|---|---|
| dump_ops_in_flight | Operations in progress; the first tool for slow ops |
| dump_historic_ops, dump_historic_slow_ops | Recent slow operations with the time of each stage |
| perf dump | Internal counters (BlueStore, RocksDB, messenger, ...) |
| config diff | Settings that differ from the defaults |
| dump_mempools | Memory usage broken down by component |
| status | Summary of the daemon's state |
In the output of dump_historic_slow_ops, each operation has a list of events with times (such as queued_for_pg, reached_pg, sub_op_committed). A large gap between two events shows where the operation was held up: waiting in the PG queue (usually a lock or a busy PG), waiting for the secondaries (another slow OSD or network) or the local commit (a slow disk).
10-6-2 The management API#
In the past the "Ceph REST API" was provided by the restful module. This module was removed in Tentacle. For automation today you have two options:
- The Dashboard API for management operations (chapter 9), with JWT authentication and versioning.
- The librados libraries (Python, C, Go, ...) for programmatic access to RADOS and even for sending MON commands (chapter 14).
import rados, json
cluster = rados.Rados(conffile='/etc/ceph/ceph.conf', name='client.monitor')
cluster.connect()
ret, out, err = cluster.mon_command(json.dumps({"prefix": "df", "format": "json"}), b'')
stats = json.loads(out)["stats"]
print(stats["total_bytes"], stats["total_used_raw_bytes"])
cluster.shutdown()10-7 Measuring RGW and CephFS#
10-7-1 Object storage#
For RGW, the common general-purpose open-source tool is warp (from the MinIO project), which measures any S3-compatible service. Before running it, create a separate user and bucket for testing:
radosgw-admin user create --uid=bench --display-name="Benchmark user"
# take the keys from the output and put them in environment variables, not on the command line
export WARP_ACCESS_KEY=... WARP_SECRET_KEY=...
warp put --host rgw.example.internal:8080 --bucket bench-put --obj.size 4MiB --concurrent 32 --duration 2m
warp get --host rgw.example.internal:8080 --bucket bench-get --obj.size 4MiB --concurrent 32 --duration 2m
warp mixed --host rgw.example.internal:8080 --bucket bench-mixed --obj.size 64KiB --duration 3mWhen measuring RGW, separate three common bottlenecks: (1) RGW itself (CPU and the number of threads or rgw_max_concurrent_requests), (2) the load balancer in front of it, and (3) the bucket index pool. Object size changes the result completely: with small objects, metadata operations (bucket index updates) dominate, and with large objects, network and disk bandwidth. Take numbers separately for both cases.
For small-object benchmarks, create the bucket with enough shards from the start or make sure dynamic resharding is enabled; otherwise a reshard happens in the middle of the test and muddles the result (chapter 4).
10-7-2 File system#
CephFS needs two kinds of test: data (read and write throughput for large files) and metadata (creating, stat-ing and deleting many small files). fio is enough for data; for metadata, tools such as mdtest (from the IOR suite in the HPC community) or a simple script are suitable.
# data: several concurrent jobs on separate files
fio --name=cephfs-seq --directory=/mnt/fs01/bench --rw=write --bs=4M --size=8G \
    --numjobs=8 --direct=1 --ioengine=libaio --iodepth=8 --group_reporting
# metadata: create and delete 100 thousand empty files
time (mkdir -p /mnt/fs01/meta && cd /mnt/fs01/meta && seq 1 100000 | xargs -P 16 -n 1000 touch)
time rm -rf /mnt/fs01/meta
ceph tell mds.fs01:0 perf dump mds_server | jq '.mds_server | {req: .handle_client_request}'The metadata test puts a heavy load on the MDS and the metadata pool and fills the MDS cache. Do not run it on a production file system, and after the test check for MDS_CACHE_OVERSIZED warnings or slow requests.
10-8 Benchmark report#
A number without context is worthless. Every benchmark report should include the following so that others can repeat or compare it:
| Section | Contents |
|---|---|
| Hardware | Number and model of nodes, CPU, memory, disk models, controller, network and MTU |
| Software | Exact Ceph version, OS and kernel, fio or tool version |
| Configuration | Pool type (replicated or EC), PG count, mClock profile, non-default settings (ceph config dump) |
| Load | Tool, full configuration file, block size, queue depth, number of clients, duration and ramp |
| Result | IOPS, throughput, mean latency and the 95th, 99th and 99.9th percentiles |
| State | ceph -s output before and after the test; was recovery or scrub in progress? |
Repeat each test at least three times and report the median. If the repetitions differ widely, something in the environment is not stable (scrub, other load, cache or disk thermal throttling). Keep Grafana open during the test to see each OSD's latency; a slow OSD usually shows itself there.
10-9 Inside the code: osd bench, rados bench and the mClock capacity measurement#
10-9-1 Two tools, two different things#
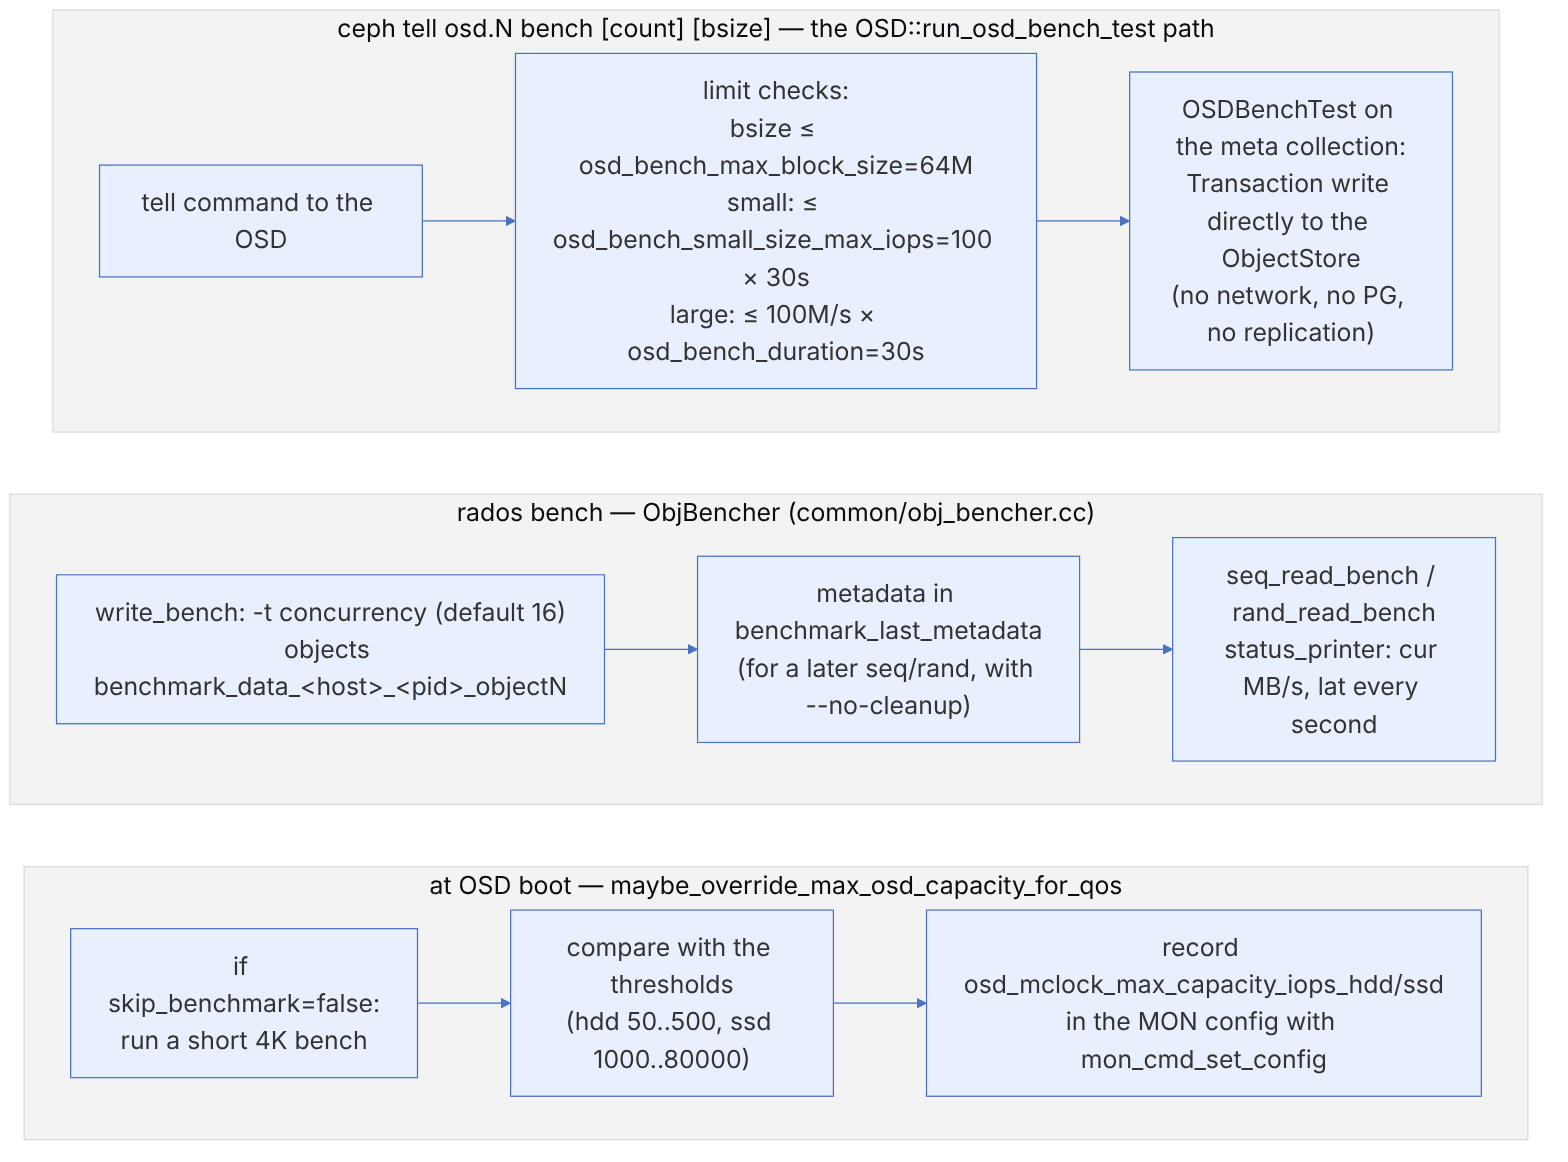
A common mistake is to compare the output of ceph tell osd.N bench with rados bench. These two tools measure two completely different layers, and their code shows the difference.
| osd bench | rados bench | |
|---|---|---|
| What it measures | The local ObjectStore (BlueStore + disk) | The whole path: client, network, PG, replication/EC, BlueStore |
| Entry function | OSD::run_osd_bench_test → OSDBenchTest | ObjBencher::aio_bench → write_bench / seq_read_bench / rand_read_bench |
| Defaults | count=1G, bsize=4M; osd_bench_* limits | -t 16, -b 4M; automatic cleanup unless --no-cleanup |
| Common misinterpretation | Taking its result as the cluster's capacity | Running from one client and drawing conclusions about the whole cluster |
pseudocode: ObjBencher::write_bench (this book's summary)
  start status_printer thread
  for slot in 0..concurrentios-1: aio_write(obj_name(slot), data)
  while elapsed < seconds:
      wait any completion c                      # lc.cond
      record latency(c) → min/max/avg, iops
      issue next aio_write in the same slot
  wait all ; write metadata object (BENCH_LASTRUN_METADATA)
print: Bandwidth (MB/sec), Average IOPS, Average Latency(s), StddevThe boot-time measurement is only a write of 12288000 bytes in 4096-byte blocks over 100 objects of 4MiB (the values in the code), and if the disk has a write cache or the OSD is busy with recovery at the same time, it produces an unrealistic number. Ceph ignores numbers outside the threshold range and warns in the OSD log. Check the recorded value and, if necessary, override it based on your own fio results (chapter 21).
Commands:
ceph tell osd.4 bench                       # 1G with 4M blocks
ceph tell osd.4 bench 12288000 4096 4194304 100   # the same parameters as the mClock boot test
ceph config dump | grep osd_mclock_max_capacity_iops
rados bench -p bench 60 write -t 32 -b 4M --no-cleanup
rados bench -p bench 60 rand -t 32 ; rados -p bench cleanup
ceph osd perf # each OSD's commit/apply latency during the test10-10 Three measurement algorithms by the numbers#
10-10-1 The osd bench safety cap#
Source in code: src/osd/OSD.cc :: OSDBenchTest::precheck, OSDBenchTest::run_test (v21.2.0 and main); in v20.2.0 the same logic is in OSD::run_osd_bench_test
Complexity: O(1) for validation; the test itself is O(count / bsize) writes
pseudocode
duration = osd_bench_duration (30)
if bsize > osd_bench_max_block_size (64M): EINVAL
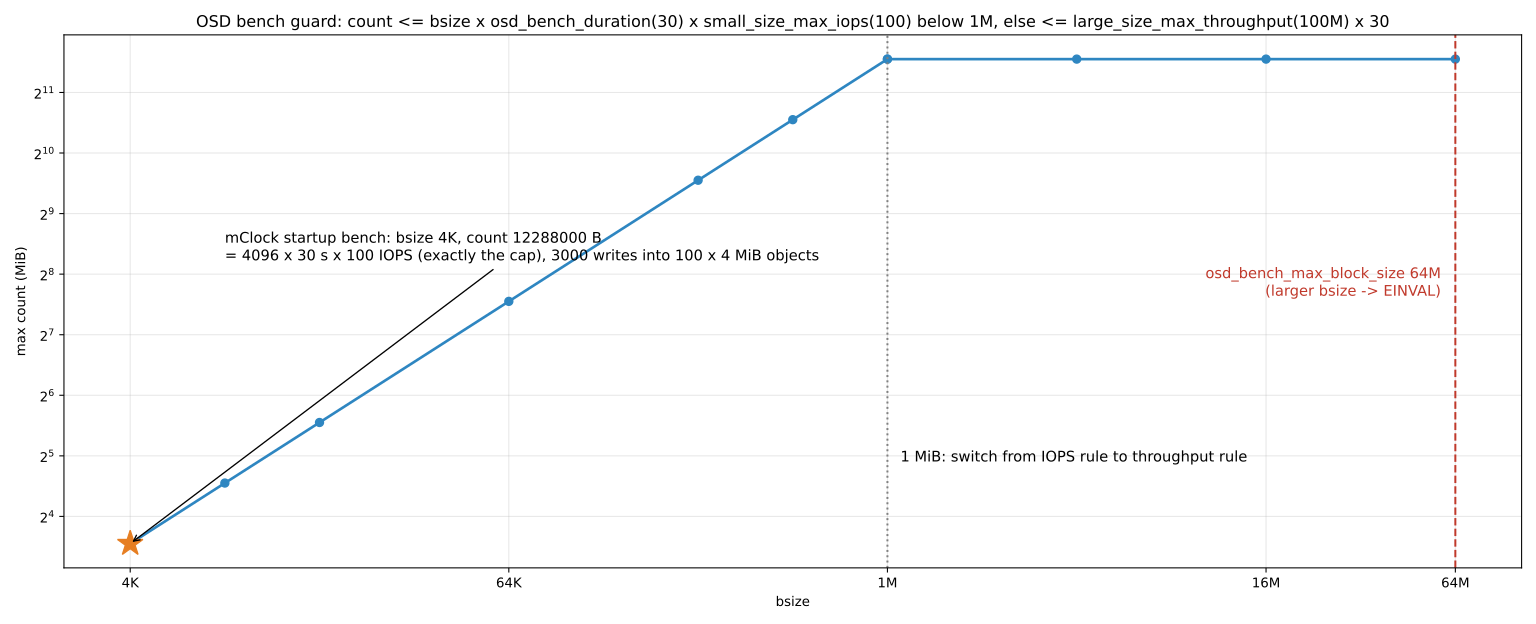
elif bsize < 1M: max_count = bsize × duration × osd_bench_small_size_max_iops (100)
else:            max_count = osd_bench_large_size_max_throughput (100M) × duration
if count > max_count: EINVAL
if osize and bsize > osize: bsize = osize
run: flush cache ; prefill onum × osize ; write count bytes in bsize pieces ; cleanup
bandwidth = count / elapsed ; iops = bandwidth / bsize
Numerical example. With ceph tell osd.4 bench 12288000 4096 4194304 100 we have bsize = 4K < 1M. So max_count = 4096 × 30 × 100 = 12288000. count is exactly equal to the cap and is accepted. The mClock boot test code uses the same number. This test spreads 3000 writes of 4K over 100 objects of 4 MB. If it takes 10 seconds, bandwidth = 1228800 B/s and iops = 300.
For a 4M block, the cap is 100M × 30 = 3145728000 bytes. The IOPS rule gives the same number for a 1M block (1M × 30 × 100), so the two rules are continuous at the 1M boundary. ceph tell osd.4 bench 4294967296 4194304 (4 GiB) is rejected with EINVAL.
10-10-2 Accepting the measured capacity for mClock#
Source in code: src/osd/OSD.cc :: OSD::maybe_override_max_osd_capacity_for_qos
Complexity: one O(3000 4K writes) test at boot; only if the current value is the default
pseudocode
if scheduler ≠ mClock or osd_mclock_skip_benchmark or store == memstore: return
key = rotational ? osd_mclock_max_capacity_iops_hdd : …_ssd
if !force_run_benchmark_on_init and current(key) ≠ default(key): return   # set by the user or a previous boot
iops = OSDBenchTest(count 12288000, bsize 4096, osize 4M, onum 100).run()
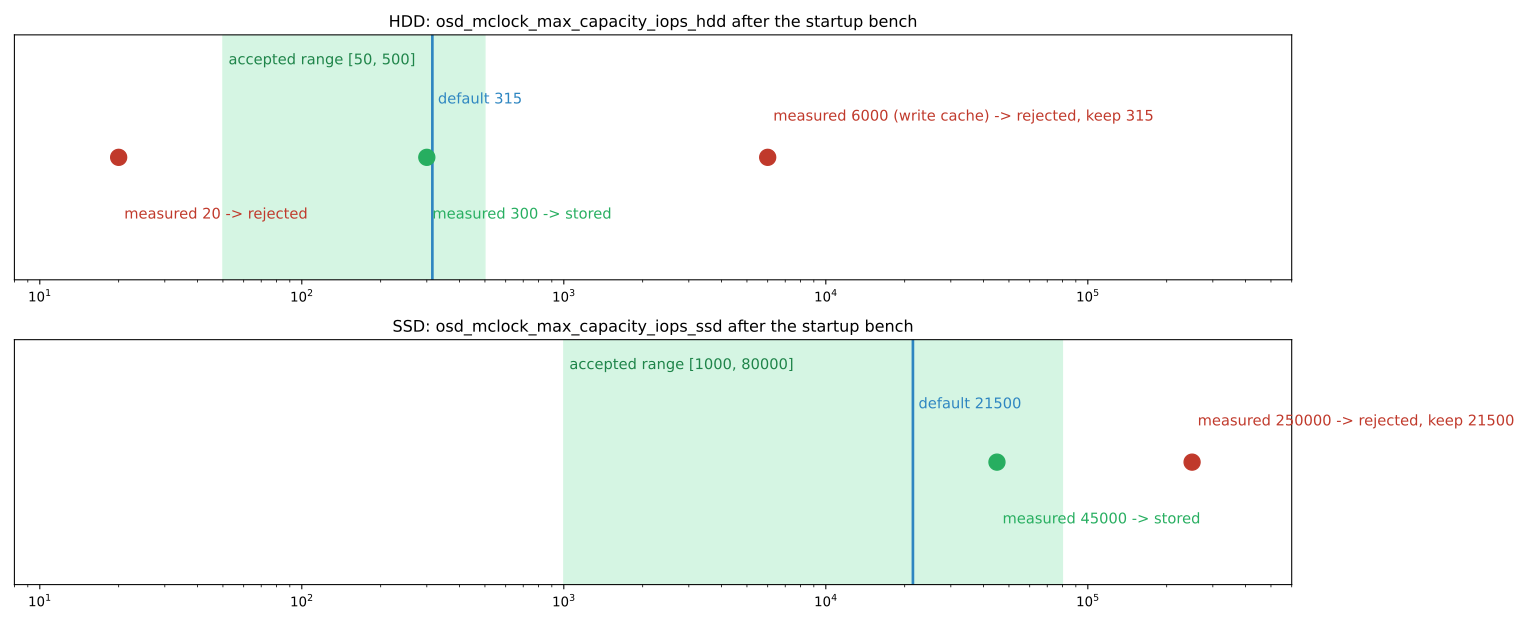
(lo, hi) = rotational ? (50, 500) : (1000, 80000)
if lo ≤ iops ≤ hi: mon_cmd_set_config(key, iops)       # in the MON configuration database
else: cluster warning and keep the current value
Numerical example.
- HDD, measured 300 IOPS: it is within [50, 500], so it is stored in the MON configuration database. From the next boot on, because the value is no longer the default, the test does not run.
- HDD with a write cache, 6000 IOPS: greater than 500, so it is rejected and 315 remains.
- SSD, measured 45000: within [1000, 80000] and stored.
- NVMe, measured 250000: rejected and 21500 remains. For such a device you must set the value yourself from fio.
To measure again, you need ceph config rm osd.N osd_mclock_max_capacity_iops_ssd and an OSD restart, or osd_mclock_force_run_benchmark_on_init = true.
10-10-3 From capacity to each class's reservation#
Source in code: src/common/mclock_common.cc :: MclockConfig::set_from_config, ClientRegistry::update_from_profile, MclockConfig::calc_scaled_cost; src/common/mclock_common.h :: HIGH_CLIENT_OPS, BALANCED, HIGH_RECOVERY_OPS (v21.2.0)
Complexity: O(1) per configuration change; O(1) cost per op
pseudocode
bw = osd_mclock_max_sequential_bandwidth_{hdd 150M | ssd 1200M} ; iops = max_capacity_iops
cost_per_io = bw / iops ; cap_per_shard = bw / num_shards (hdd 1 , ssd 8)
for class in (client, background_recovery, background_best_effort):
    res = r ? r × cap_per_shard : minimum ; lim = l ? l × cap_per_shard : unlimited ; weight = w
cost(op) = max(op_bytes, cost_per_io)      # small ops cost at least one "full IO"
Numerical example (HDD with the defaults). cost_per_io = 157286400 / 315 = 499322 bytes. So a 4K write costs the equivalent of 488 KiB. With the default balanced profile (v21.2.0):
- client: reservation 0.5 × 150 MiB/s, equivalent to 157.5 small ops per second.
- background_recovery: the same 157.5.
- background_best_effort: reservation 0.05, equivalent to 15.75 ops, and limit 0.9, equivalent to 283.5 ops.
In high_client_ops the client reservation rises to 189 and its weight to 2. On an SSD with 21500 IOPS and 8 shards, cost_per_io = 58525 bytes, and the client reservation in balanced is 1343.75 ops per shard and 10750 ops in total. That is, exactly half of 21500.
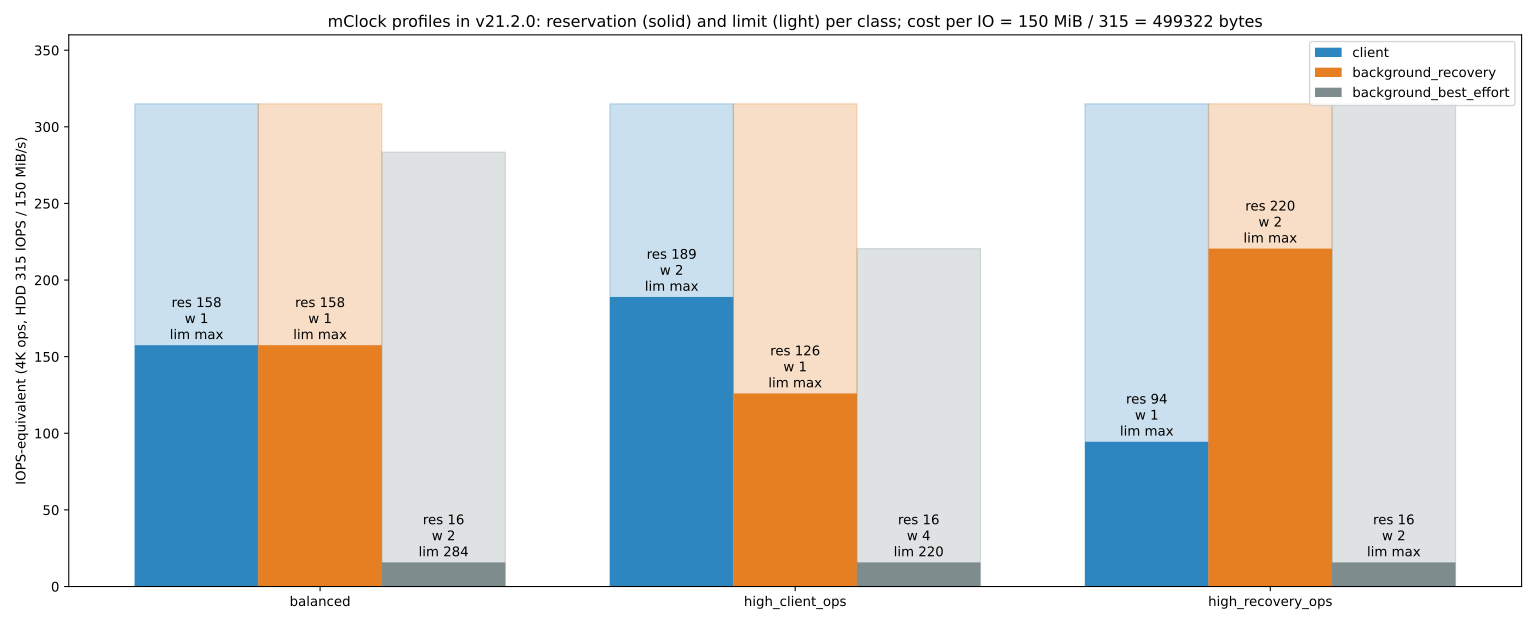
Version-dependent. In v20.2.0 the profile values are defined in src/osd/scheduler/mClockScheduler.cc, and the background_best_effort class has reservation 0 and weight 1. In v21.2.0 these values moved to src/common/mclock_common.h, and best_effort has reservation 0.05, with weight 4 in high_client_ops and weight 2 in balanced and high_recovery_ops. Before relying on the numbers, read ceph config show osd.N | grep mclock_scheduler on your own release.
10-11 Real measurement on a test cluster#
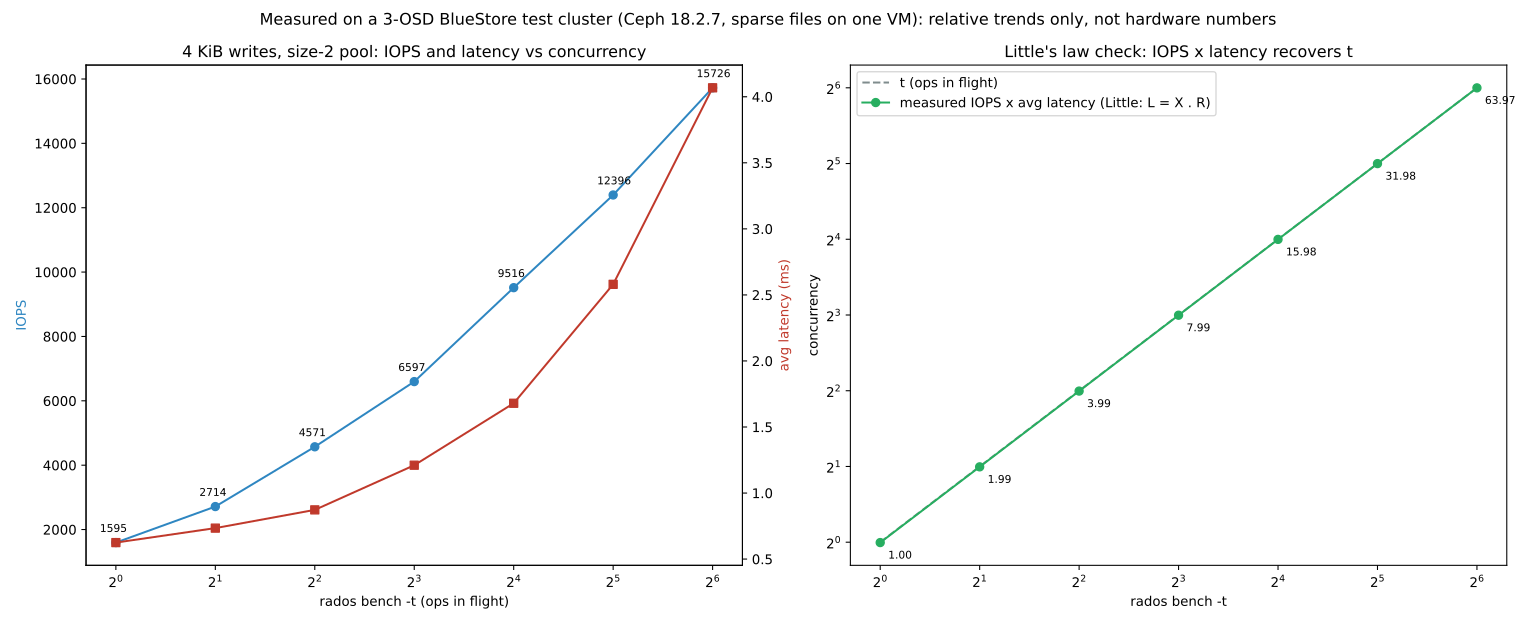
The two measurements in this section were run on a three-OSD BlueStore cluster: Ceph 18.2.7 from Debian packages, with ten-gigabyte sparse files on a virtual machine's disk. The absolute numbers do not represent real hardware, because the OS page cache and a shared CPU are involved. But the shape of the curves is what you will see on any cluster. The goal is to learn to read these curves.
10-11-1 Concurrency, latency and Little's law#
Source in code: rados bench (src/common/obj_bencher.cc); L = X · R
Complexity: O(1) to check each point
pseudocode
rados bench -t T: always exactly T operations in flight ← each completion sends a new op
X = measured IOPS ; R = mean latency
Little's law for a closed system: L = X · R = T
so: R = T / X  ←  once X saturates, R grows linearly with T
Measurement (4 KiB writes, pool with size = 2, 8 seconds per point).
| -t | IOPS | Mean latency (ms) | IOPS × latency |
|---|---|---|---|
| 1 | 1595 | 0.62 | 1.00 |
| 4 | 4571 | 0.87 | 3.99 |
| 16 | 9516 | 1.68 | 15.98 |
| 64 | 15726 | 4.07 | 63.97 |
The last column is effectively T itself. This proves that rados bench is a closed-loop workload. The practical consequence: if raising -t increases latency but IOPS grows less than proportionally (from 16 to 64, four times the concurrency gave only 1.65 times the IOPS), you have reached a bottleneck. From there on, more concurrency only makes the queue longer.
In a benchmark report, always write -t next to IOPS. An IOPS figure without concurrency is meaningless. When measurement is done with a fixed iodepth (fio) or a fixed rate (open loop), this relationship takes a different form.
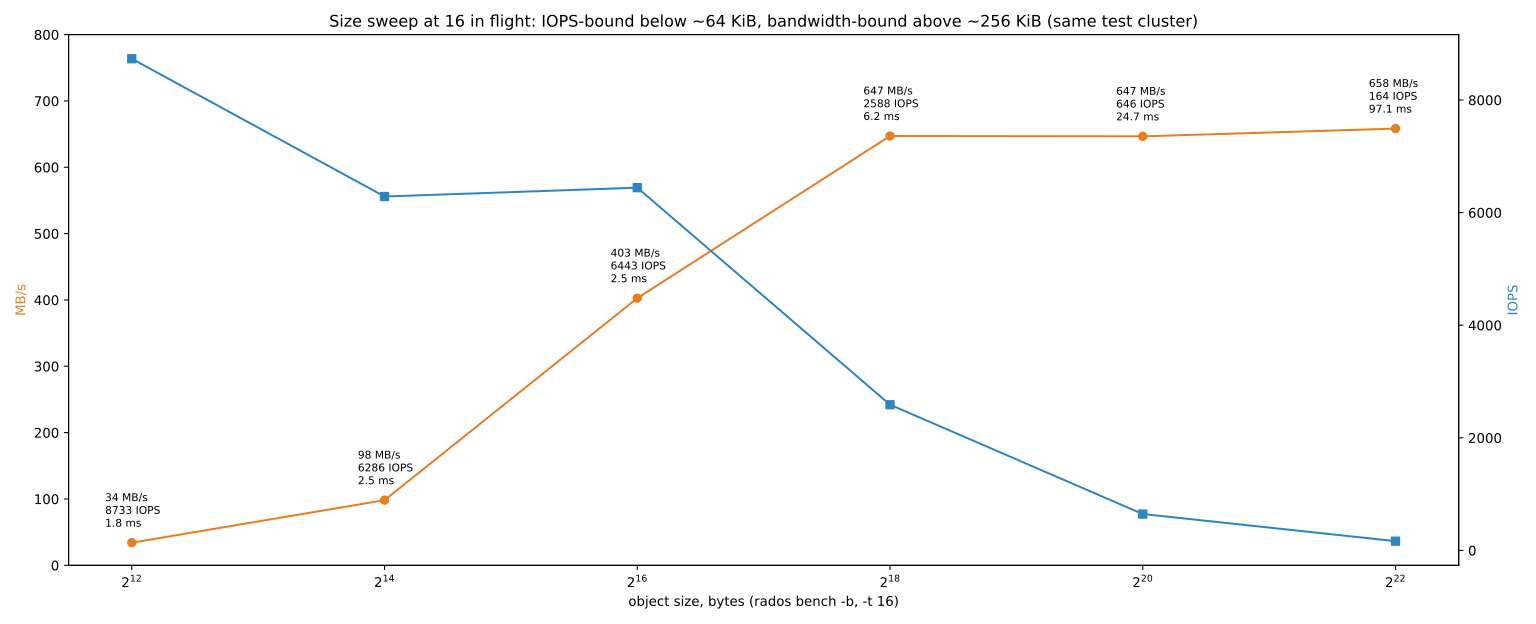
10-11-2 Object size: from the IOPS ceiling to the bandwidth ceiling#
Measurement (-t 16). From 4 KiB to 64 KiB, IOPS stays roughly constant (8733, 6286 and 6443) and MB/s grows with size. That is, the bottleneck is the per-operation cost: CPU, messaging and the RocksDB transaction. From 256 KiB up, MB/s levels off at about 650 and IOPS falls with size. The bottleneck is now bandwidth.
Measure the break point (about 64 to 256 KiB in this cluster) separately for each cluster. This point tells you which workloads should be measured in "IOPS" and which in "MB/s".
In BlueStore there is another important point. Writes smaller than bluestore_prefer_deferred_size are first written to the RocksDB WAL and applied later (chapter 12). On HDDs the latency curve breaks right there.
10-11-3 Memory profiling#
OSD memory usage is controlled by osd_memory_target (default 4 GB, autotuned in cephadm). When a daemon uses more memory than expected, first see where the memory went:
ceph tell osd.3 dump_mempools | jq '.mempool.by_pool | to_entries | sort_by(-.value.bytes) | .[0:5]'
ceph tell osd.3 heap stats
ceph tell osd.3 heap release           # return tcmalloc's free memory to the OS
ceph orch ps --daemon-type osd --format json | jq -r '.[] | "\(.daemon_name) \(.memory_usage)"' | sort -nk2 | tail
To debug a memory leak, temporarily enable tcmalloc's built-in profiler:
ceph tell osd.3 heap start_profiler
# wait a few minutes or hours for the pattern to appear
ceph tell osd.3 heap dump
ceph tell osd.3 heap stop_profiler
# heap files are created in the daemon's log path and analysed with pprof (google-perftools)If heap stats shows a lot of "freelist" or "unmapped" memory in tcmalloc, heap release usually brings RSS down immediately. If most of the memory is in the bluestore_cache_* mempools, this behaviour is normal and autotune keeps it within osd_memory_target. If osd_pglog is large, the number of PGs per OSD or the PG log length is probably high.
10-11-4 ceph-objectstore-tool#
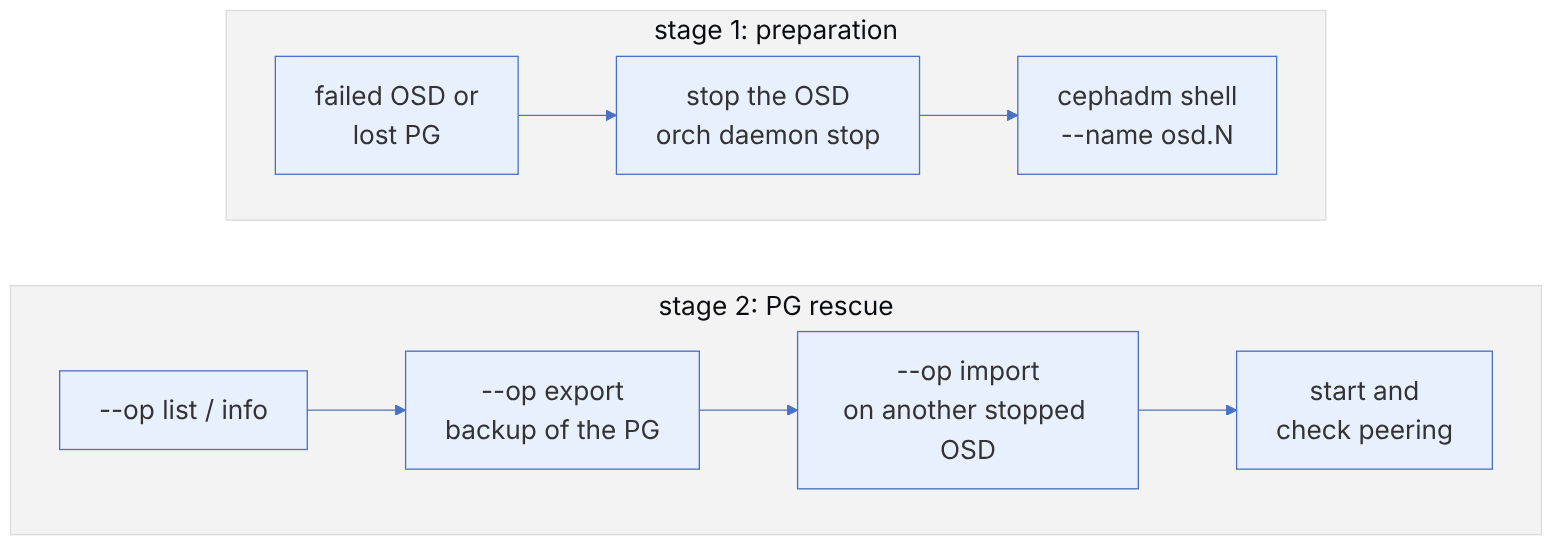
ceph-objectstore-tool works directly on the data of a stopped OSD: it can list PGs and objects, export or import a PG, read metadata and, in special cases, fix it. Its classic use is rescuing a PG all of whose healthy copies were on OSDs that no longer come up, but whose disks are still readable.
ceph orch daemon stop osd.12
cephadm shell --name osd.12
# inside the shell
ceph-objectstore-tool --data-path /var/lib/ceph/osd/ceph-12 --op list-pgs
ceph-objectstore-tool --data-path /var/lib/ceph/osd/ceph-12 --pgid 5.3a --op info
ceph-objectstore-tool --data-path /var/lib/ceph/osd/ceph-12 --pgid 5.3a --op export --file /var/log/ceph/pg5.3a.export
exit
# on the destination OSD (also stopped)
ceph orch daemon stop osd.20
cephadm shell --name osd.20 -- ceph-objectstore-tool --data-path /var/lib/ceph/osd/ceph-20 --op import --file /var/log/ceph/pg5.3a.export
ceph orch daemon start osd.20
ceph pg 5.3a query | jq .stateThis tool has no safeguards: it can delete a PG, corrupt metadata and make the state irreversible. Always take a backup export before any modifying operation, use --dry-run where possible, and turn to it only when the normal procedures (bringing the OSD up, automatic recovery) have failed. Write the export file to a path that survives outside the container (in cephadm the daemon's log path is mounted on the host).
10-11-5 Retired tools#
| Old tool | Status today | Replacement |
|---|---|---|
| ceph-medic | No active development (last repository change in 2020) and removed from the monitoring documentation | ceph health detail, cephadm health checks, Prometheus alerts |
| restful module | Removed in Tentacle | Dashboard API |
| rados load-gen | Not in the current rados manual | fio with the rados or rbd engine |
| "Experimental" BlueStore | Stable and the default since Luminous; FileStore is unsupported since Reef | BlueStore (chapter 12) |
cephadm itself performs host prerequisite checks (cephadm check-host), and the orchestrator raises warnings such as CEPHADM_HOST_CHECK_FAILED or CEPHADM_STRAY_DAEMON. This is the role ceph-medic played for configuration checks in the ceph-deploy era.
cephadm check-host
ceph health detail | grep -i cephadm- Layered measurement: disk and network, then RADOS, then the interfaces, then the real workload.
- Measure SSDs for DB/WAL with sync writes at queue depth 1.
- Test the MTU end to end with
ping -M do. - Report latency percentiles, not just the mean.
dump_historic_slow_opsshows the stage where an operation waits.- Memory: mempools and heap stats first, then the profiler.
ceph-objectstore-toolonly on a stopped OSD and after a backup export.
10-12 Supplementary and up to date#
- FileStore is unsupported from Reef on (upgrades raise the
OSD_FILESTOREwarning), and BlueStore is the only supported storage stack for the classic OSD; crimson/SeaStore are still technology previews (Squid and Tentacle). - The restful module was removed in Tentacle.
- cephadm: host checks and orchestrator warnings replaced the side tools for configuration checks.
- mClock affects benchmark results: the active profile (balanced, high_client_ops) sets the client's share; state the profile in the benchmark report.
10-13 Hands-on exercise#
- 1. On an empty disk, run this chapter's three fio tests and write the results in a table. Compare the sync test on a consumer SSD and a datacenter SSD (if you have one).
- 2. Measure the public and cluster networks between every pair of nodes with iperf3 and ping with a large MTU.
- 3. Find the three slowest OSDs with a
ceph tell osd.N benchloop. - 4. Run
rados benchwith 4 MB and 4 KB blocks and compare the throughput and IOPS ratio with the theoretical ceiling. - 5. Run this chapter's fio file with the rbd engine and extract the p99 latency. Then change the mClock profile and repeat.
- 6. In a lab, export a PG from a stopped OSD, import it on another OSD and watch the peering.
10-14 Review questions#
- 1. Why should performance measurement be done layer by layer?
- 2. Why is fio preferred over dd for measuring disks?
- 3. Why is the sync write test at queue depth 1 important when choosing an SSD?
- 4. What symptoms does a mismatched MTU cause in Ceph?
- 5. In the theoretical ceiling example, why did the network become the bottleneck?
- 6. What is the difference between
ceph tell osd.N benchandrados bench? - 7. Why should an RBD image be filled before measuring random writes?
- 8. What is the difference between the admin socket and
ceph tell, and when is each more useful? - 9. In the output of
heap stats, what does freelist memory mean? - 10. What steps are needed before using
ceph-objectstore-tool?
Answers to these questions are in Appendix E: Answers to Review Questions. Answers to this chapter's questions →
10-15 Sources for this chapter#
- rados manual
https://docs.ceph.com/en/latest/man/8/rados/ - rbd manual
https://docs.ceph.com/en/latest/man/8/rbd/ - Control commands (osd bench
https://docs.ceph.com/en/latest/rados/operations/control/ - Memory profiling
https://docs.ceph.com/en/latest/rados/troubleshooting/memory-profiling/ - ceph-objectstore-tool manual
https://docs.ceph.com/en/latest/man/8/ceph-objectstore-tool/ - Troubleshooting OSDs
https://docs.ceph.com/en/latest/rados/troubleshooting/troubleshooting-osd/ - Ceph API
https://docs.ceph.com/en/latest/mgr/ceph_api/ - librados Python
https://docs.ceph.com/en/latest/rados/api/python/ - fio documentation
https://fio.readthedocs.io/en/latest/fio_doc.html - iperf3
https://software.es.net/iperf/ - warp (S3 benchmark
https://github.com/minio/warp - IOR and mdtest
https://github.com/hpc/ior - ceph-medic repository
https://github.com/ceph/ceph-medic - Tentacle release notes
https://docs.ceph.com/en/latest/releases/tentacle/