Monitoring Ceph: Prometheus, ceph-exporter, Alerts and Observability
TL;DR this chapter in a few lines
- The monitoring stack is the MGR prometheus module plus ceph-exporter for per-daemon perf counters, Prometheus, Alertmanager and Grafana with the ceph-mixin dashboards and alerts.
- Perf counters are atomic variables in each daemon; know their types (counters, averages, histograms) to read them correctly.
- Watch a few key signals: health, PG states, latency, capacity and slow ops; add your own alert rules next to ceph-mixin, not instead of it.
- Tentacle's mgmt-gateway puts every monitoring UI behind one entry point; build SLO views on top of the ceph-mixin dashboards.
20-1 Before you start#
20-1-1 What questions does this chapter answer?#
ceph -s is enough for a quick look, but to answer questions like "why has write latency been high since Tuesday?" or "which OSD was the slowest in the last hour?" we need time series, alert rules and dashboards. Today Ceph has a standard monitoring stack that cephadm deploys: the prometheus module in the mgr, the ceph-exporter daemon on every host, node-exporter, Prometheus, Alertmanager and Grafana, and in Tentacle the mgmt-gateway.
- What data does each component of the stack produce, and why were performance counters moved from the mgr to ceph-exporter?
- Which metrics are the most important signals?
- What makes a good alert rule for Ceph?
- How are the daemons' internal counters (perf counters) built and read?
- What problem do mgmt-gateway and oauth2-proxy solve?
20-2 Architecture of the monitoring stack#
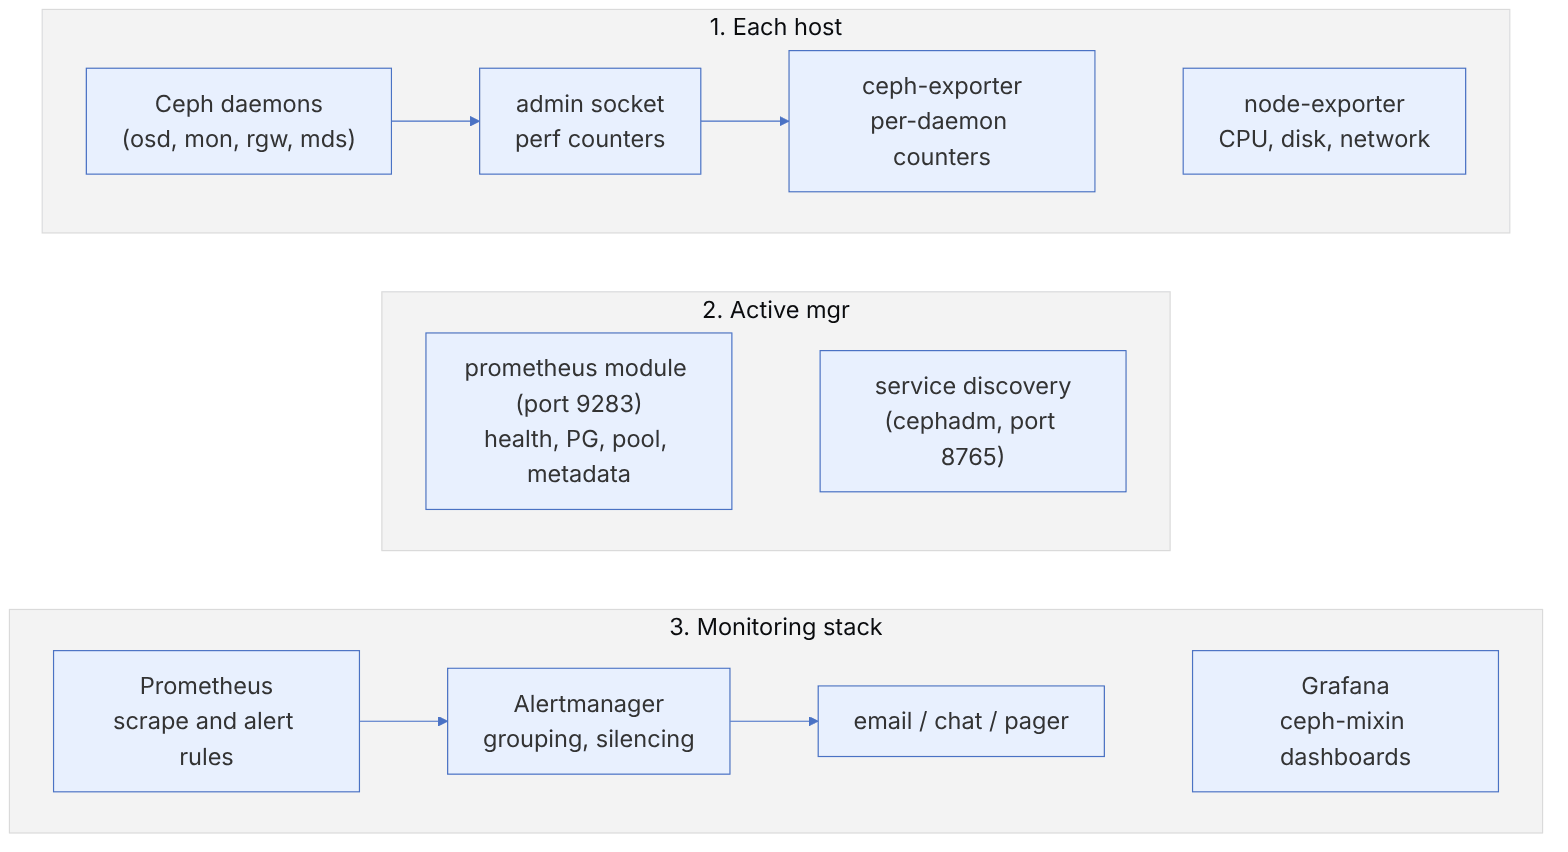
ceph mgr module enable prometheus
ceph orch apply node-exporter
ceph orch apply ceph-exporter
ceph orch apply alertmanager
ceph orch apply prometheus
ceph orch apply grafana
ceph orch ls --service-type prometheus
ceph dashboard get-prometheus-api-host| Component | Data | Note |
|---|---|---|
| prometheus module in the mgr | health, health codes, OSD and PG state, pool usage, daemon metadata, RBD image metrics (optional) | default port 9283; only the active mgr serves data |
| ceph-exporter | performance counters of each local daemon (from the admin socket) | on every host; reduces load on the mgr |
| node-exporter | host CPU, memory, disk, network | for correlating Ceph slowness with hardware |
| Prometheus | time series storage and rule evaluation | ceph-mixin rules ship with cephadm |
| Alertmanager | grouping, silencing and sending alerts | the Dashboard displays the alerts |
| Grafana | ready-made dashboards | embedded in the Dashboard |
Change from older versions. According to the prometheus module documentation, daemon performance counters are no longer published by this module by default, and this job has been handed to ceph-exporter; the mgr/prometheus/exclude_perf_counters option should only be disabled when no ceph-exporter is deployed. The reason: collecting all counters from a single point degrades mgr performance in large clusters.
Only the active mgr publishes cluster metrics. If you have an external Prometheus, define all mgrs as targets (or use service discovery at http(s)://<mgr>:8765/sd/prometheus/sd-config?service=...) so that scraping is not interrupted after a failover. The behaviour of standby mgrs is set with standby_behaviour and their response code with standby_error_status_code.
20-2-1 External Prometheus#
# prometheus.yml — this book's example for an external Prometheus
scrape_configs:
  - job_name: ceph
    honor_labels: true
    http_sd_configs:
      - url: http://mgr1.example.internal:8765/sd/prometheus/sd-config?service=mgr-prometheus
  - job_name: ceph-exporter
    honor_labels: true
    http_sd_configs:
      - url: http://mgr1.example.internal:8765/sd/prometheus/sd-config?service=ceph-exporter
  - job_name: node
    http_sd_configs:
- url: http://mgr1.example.internal:8765/sd/prometheus/sd-config?service=node-exporterhonor_labels: true is needed so that labels Ceph sets, such as ceph_daemon and instance, are not overwritten by Prometheus labels. Check the exact service names in service discovery against your version's documentation. According to the cephadm documentation, if mgr/cephadm/secure_monitoring_stack is enabled or mgmt-gateway is deployed, this endpoint serves over https with basic auth, and the job definition must have basic_auth and tls_config.
20-3 From inside the code: perf counters#
20-3-1 Building counters#
Every Ceph daemon defines its counters with PerfCountersBuilder (src/common/perf_counters.h). Each counter has a numeric key, a name, a type and a priority. The main types:
| Builder function | Type | Example |
|---|---|---|
| add_u64 | instantaneous value (gauge) | number of operations in flight |
| add_u64_counter | increasing counter | total number of write operations |
| add_time_avg | sum of time and count (for an average) | op_w_latency |
| add_u64_counter_histogram | two-dimensional histogram (e.g. size × latency) | latency distribution by size |
Priorities range from PRIO_CRITICAL=10 to PRIO_DEBUGONLY=0 (PRIO_INTERESTING=8, PRIO_USEFUL=5). This priority has a practical role: ceph-exporter only publishes counters whose priority is at least exporter_prio_limit, whose default in src/common/options/ceph-exporter.yaml.in is 5. So DEBUGONLY counters do not reach Prometheus unless you lower this limit (which greatly increases the volume of metrics).
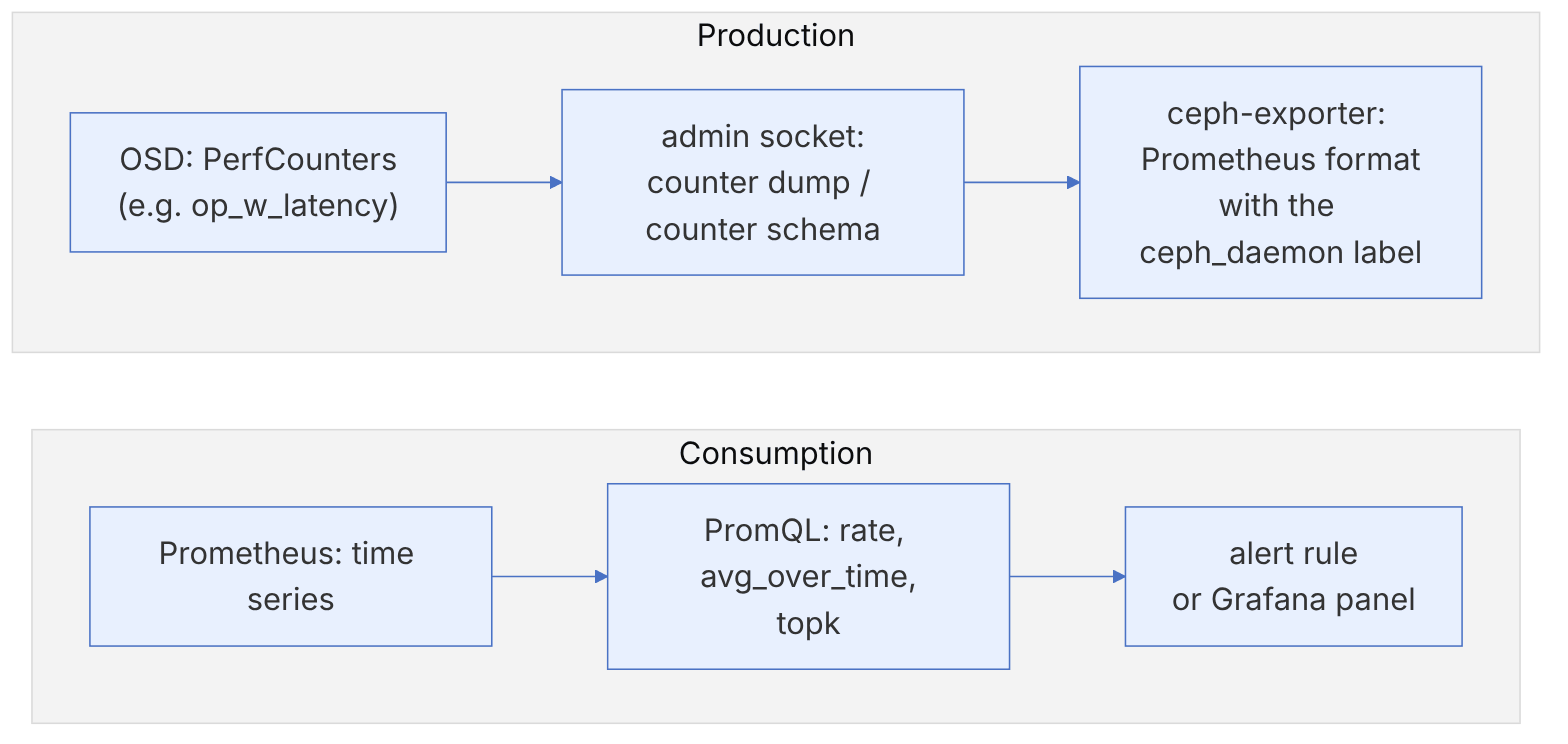
# reading counters directly on the host
ceph daemon osd.3 counter schema | jq 'keys' | head
ceph daemon osd.3 counter dump | jq '.osd[0].counters | {op_w, op_r}'
ceph daemon osd.3 perf dump osd | jq '.osd.op_w_latency'       # older form: avgcount and sum
ceph config get client.ceph-exporter exporter_prio_limitThe counter dump and counter schema commands are registered in src/common/ceph_context.cc and return the labeled form of the counters; perf dump is the older form. ceph-exporter reads from the sockets in the exporter_sock_dir directory every exporter_stats_period (default 5 seconds) and publishes on port exporter_http_port (default 9926).
20-3-2 From time_avg to latency#
An add_time_avg counter has two values: sum (total seconds) and avgcount (count). The average latency over an interval is the ratio of the increase in these two, not the ratio of the raw values (which is the average over the daemon's whole lifetime):
avg_latency(window) = Δsum / Δavgcount
PromQL: rate(ceph_osd_op_w_latency_sum[5m]) / rate(ceph_osd_op_w_latency_count[5m])Read the exact metric names from the endpoint itself (curl -s http://host:9926/metrics | grep op_w_latency); suffixes (_sum, _count) and labels may differ between versions and between the mgr module and ceph-exporter.
20-4 Key signals#
| Signal | Example metric or PromQL | Why |
|---|---|---|
| Overall health | ceph_health_status (0 healthy, 1 warning, 2 error) | status summary |
| Specific health code | ceph_health_detail{name="MON_DOWN"} == 1; for SLOW_OPS the separate metric ceph_healthcheck_slow_ops > 0 (the HEALTH_CHECKS list in module.py) | precise alerting on the codes from chapter 17 |
| Down OSDs | count(ceph_osd_up == 0) | loss of capacity and redundancy |
| Inactive PGs | ceph_pool_metadata * on(cluster,pool_id,instance) group_left() (ceph_pg_total - ceph_pg_active) > 0 (exactly the CephPGsInactive rule) | I/O stops, per pool |
| Pool fullness | ceph_pool_percent_used (a fraction between 0 and 1, not a percentage) | preventing OSD_FULL |
| quorum | ceph_mon_quorum_status | health of the control plane |
| OSD write latency | rate(ceph_osd_op_w_latency_sum[5m]) / rate(ceph_osd_op_w_latency_count[5m]) per ceph_daemon | user-visible slowness |
| mirroring | topk by (cluster,ceph_daemon,image,namespace,pool) (1, ceph_rbd_mirror_snapshot_image_local_timestamp) - topk by (…) (1, ceph_rbd_mirror_snapshot_image_remote_timestamp) != 0 (the CephRBDMirrorImagesNotInSync rule) | RPO lag |
All metric names and expressions in the table above were checked in November 2026 against src/pybind/mgr/prometheus/module.py and the official alert rules monitoring/ceph-mixin/prometheus_alerts.yml on the main branch. The ceph-mixin rules file on the main branch (at the time of writing) has 109 rules, including CephHealthError, CephMonDownQuorumAtRisk, CephOSDDown, CephOSDNearFull, CephPGsInactive, CephPGUnavailableBlockingIO, CephSlowOps, CephPoolGrowthWarning, and hardware rules (such as PowerSupplyFailed) and NVMe-oF rules.
20-5 Designing alert rules#
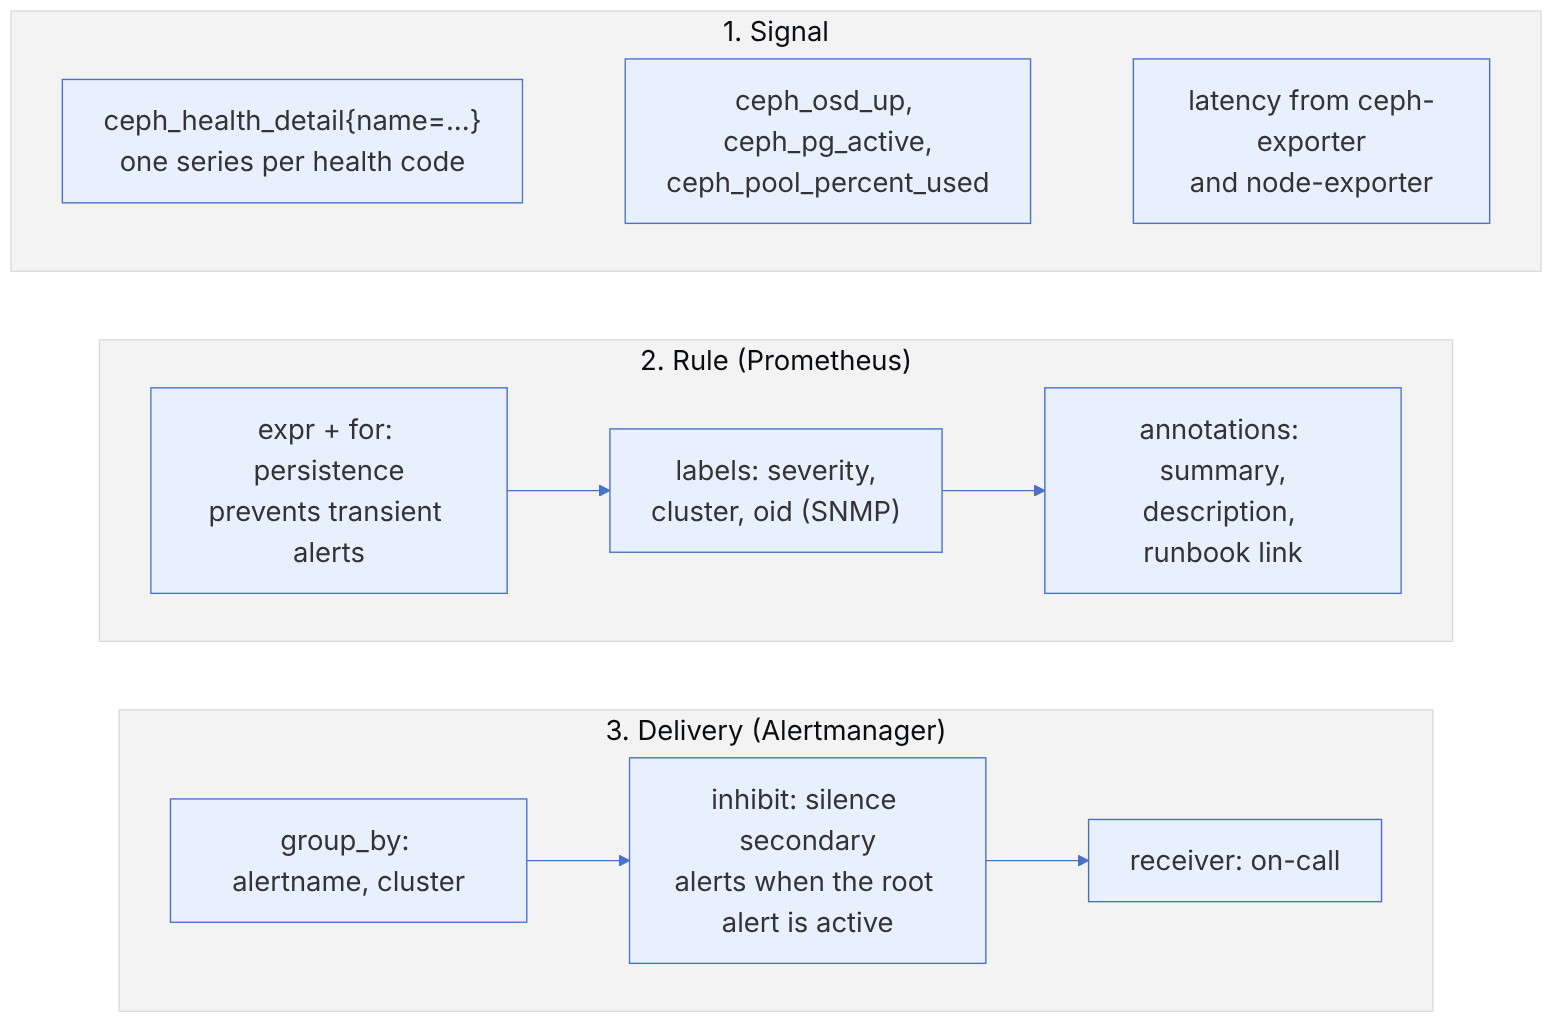
The rules below are this book's own examples and do not replace ceph-mixin; they show the pattern for adding local rules:
groups:
- name: ceph-local
  rules:
  - alert: CephWriteLatencyHigh
    expr: |
      ( rate(ceph_osd_op_w_latency_sum[5m]) / rate(ceph_osd_op_w_latency_count[5m]) ) > 0.05
    for: 15m
    labels: { severity: warning }
    annotations:
      summary: "write latency of {{ $labels.ceph_daemon }} above 50 milliseconds"
      runbook: "https://wiki.example.internal/runbooks/ceph-slow-osd"
  - alert: CephPoolFillingFast
    expr: predict_linear(ceph_pool_percent_used[6h], 3 * 24 * 3600) > 0.85
    for: 1h
    labels: { severity: warning }
    annotations:
summary: "pool {{ $labels.pool_id }} will pass 85% within the next three days"# Alertmanager: silence the single-OSD alert when the whole host is down
inhibit_rules:
- source_matchers: [ alertname = "CephOSDHostDown" ]
target_matchers: [ alertname = "CephOSDDown" ]
equal: [ cluster ]The thresholds above (50 milliseconds, 85%) are examples. Derive the real threshold from your own cluster's baseline behaviour (for example the 95th percentile of the past week) and the service SLOs. An alert that fires every day for no reason is quickly ignored.
In cephadm, custom rules sit alongside the default rules: register the file with ceph config-key set mgr/cephadm/services/prometheus/alerting/custom_alerts.yml -i custom_alerts.yml and then run ceph orch reconfig prometheus (cephadm monitoring documentation). According to the same documentation, custom rules are not processed with Jinja.
20-6 The lower layer: from an atomic variable to a /metrics line#
Every number on a dashboard starts as a std::atomic<uint64_t> variable in a daemon's memory. This section follows its path to Prometheus at the level of bytes and code, so you know exactly what each number measures and where it might lie.
20-6-1 Structure of a counter#
perf_counter_data_any_d in src/common/perf_counters.h keeps a type byte (bitmask), a priority and a unit for each counter:
| Type bit | Value | Meaning |
|---|---|---|
PERFCOUNTER_TIME | 0x1 | a time value; stored as nanoseconds in a u64 (to_nsec) |
PERFCOUNTER_U64 | 0x2 | an integer (one of TIME or U64 must be set) |
PERFCOUNTER_LONGRUNAVG | 0x4 | a "sum + count" pair for a long-run average |
PERFCOUNTER_COUNTER | 0x8 | a monotonically increasing counter (as opposed to a gauge) |
PERFCOUNTER_HISTOGRAM | 0x10 | a histogram (e.g. two-dimensional size × latency) |
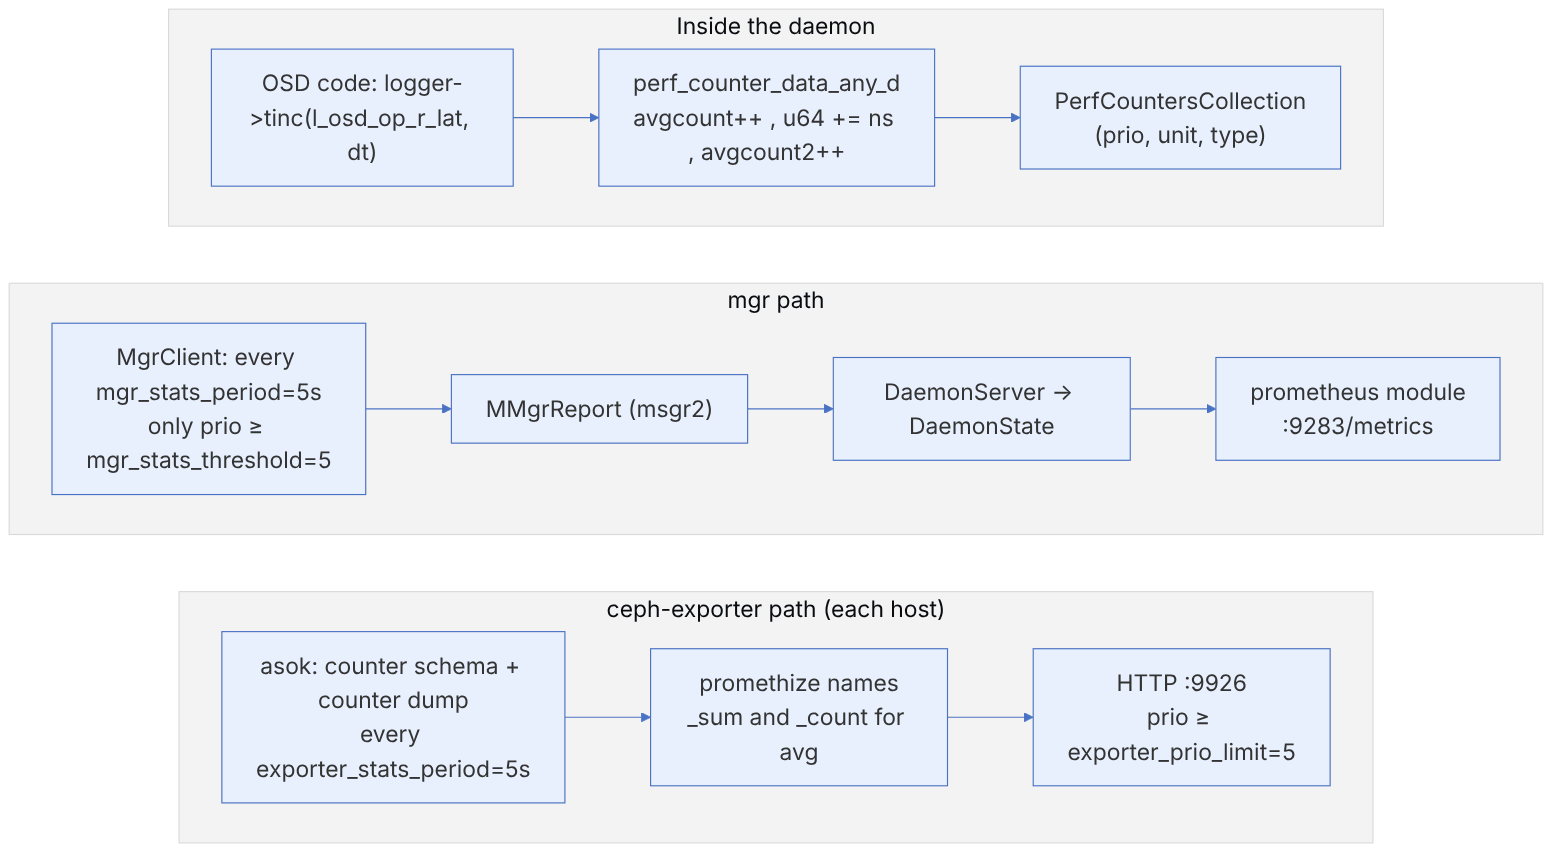
The priorities are PRIO_CRITICAL=10, PRIO_INTERESTING=8, PRIO_USEFUL=5, PRIO_UNINTERESTING=2 and PRIO_DEBUGONLY=0. This number decides whether the counter leaves the daemon at all: MgrClient only reports counters whose configured priority is >= mgr_stats_threshold (default 5). ceph-exporter does the same with exporter_prio_limit=5. So a counter you see in ceph daemon osd.3 perf dump but not in Prometheus probably has a priority below 5.
20-6-2 A lock-free average#
For a LONGRUNAVG counter, tinc does three things in this order: avgcount++, then u64 += nsec, and finally avgcount2++. The reader (read_avg) works in reverse:
pseudocode: read_avg (a seqlock-like pattern)
  repeat:
    c   = avgcount2        # the "write finished" counter
    sum = u64
  until avgcount == c      # no write started in between
  return (sum, c)
If a tinc happens in the middle of a read, avgcount gets ahead of avgcount2 and the loop repeats. So the (sum, count) pair is always consistent, without a mutex on the hot I/O path. Because there are multiple concurrent writers (shard threads), this guarantee is "almost" consistent, which is enough for statistics but not for exact accounting.
The raw number you see is the average since the daemon started. perf dump gives avgcount and sum (in seconds) and avgtime=sum/avgcount for op_r_latency. avgtime is the average since the daemon started, and after a month of running it practically does not show a 5-minute slowdown. Always use the difference between two samples.
Numerical example#
Suppose we took two samples from osd.3 60 seconds apart:
| Sample | op_r_latency.avgcount | op_r_latency.sum (s) | Reported avgtime |
|---|---|---|---|
| t=0 | 50,000 | 120.5 | 2.41 ms |
| t=60s | 53,000 | 123.5 | 2.33 ms |
| Difference | 3,000 | 3.0 | 1.00 ms (the real latency of this minute) |
Read IOPS in this minute is 3000/60=50. avgtime went from 2.41 to 2.33 and seems to show a small improvement, while the real latency of this minute was 1ms. The reverse is also possible: a minute with 50ms latency raises avgtime only slightly. In PromQL the equivalent of this difference is:
rate(ceph_osd_op_r_latency_sum[1m]) / rate(ceph_osd_op_r_latency_count[1m])20-6-3 The admin socket protocol#
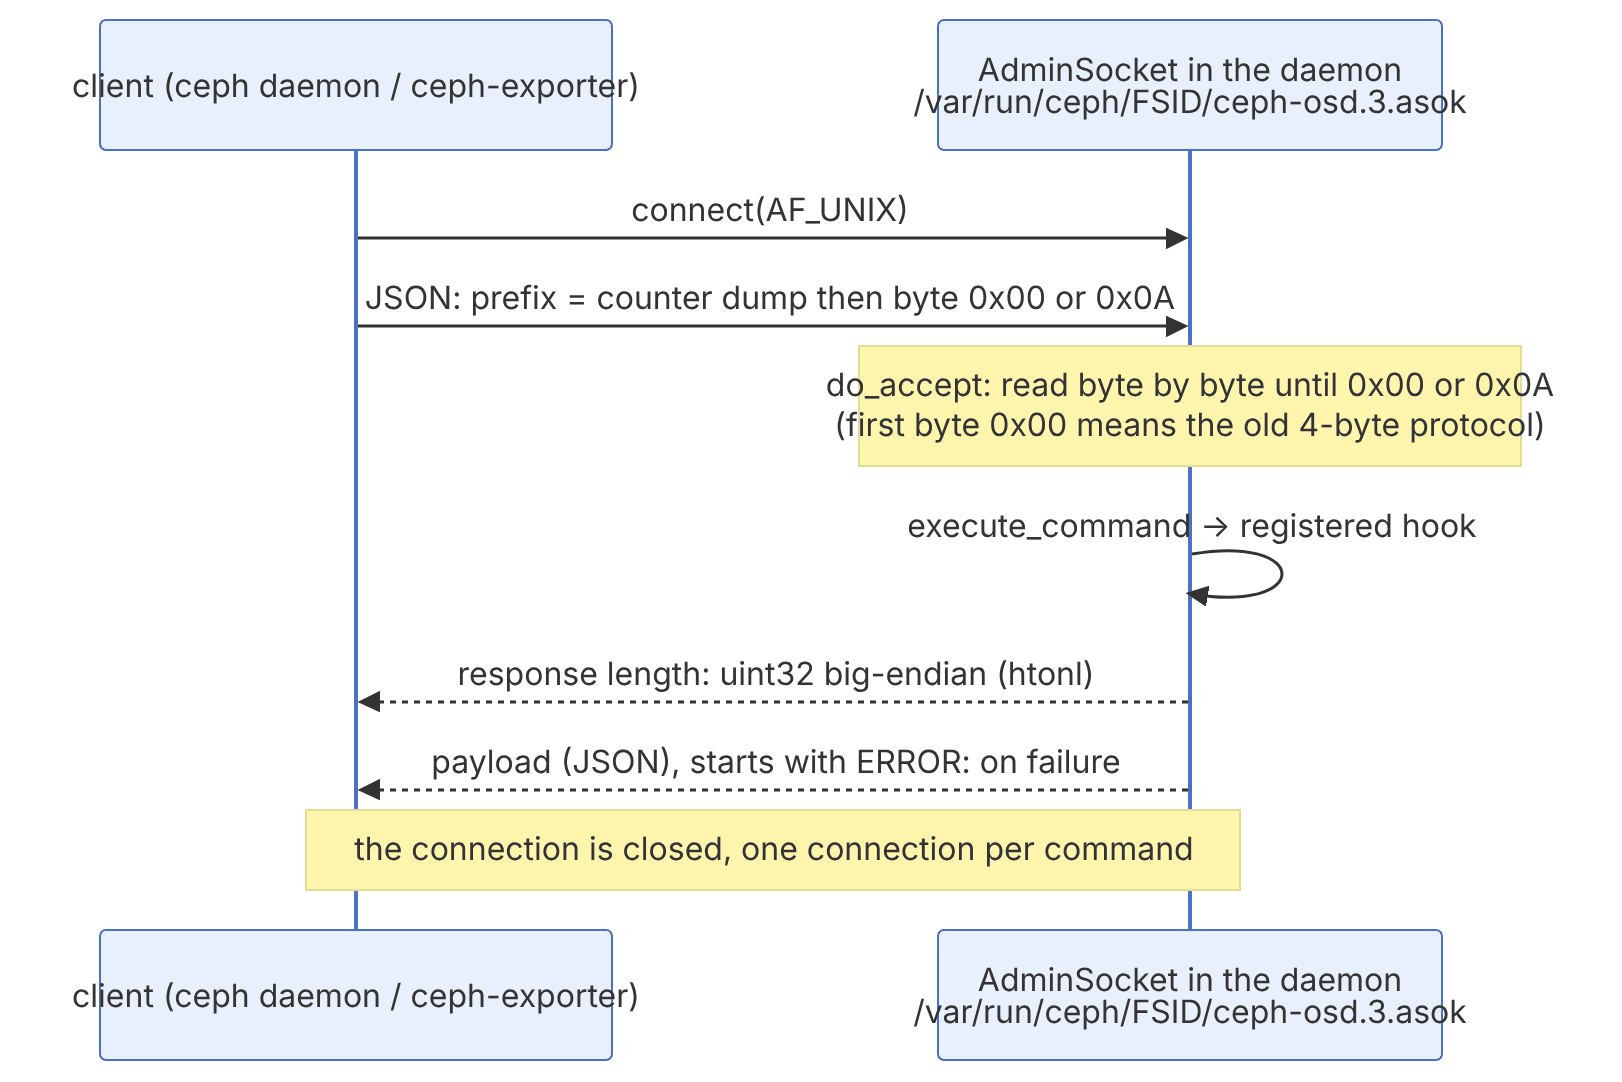
In AdminSocket::do_accept the error code is not sent on the wire. If a command fails, the response starts with the string ERROR: , so automated tools must check for this prefix. A minimal client (written for this book, only to understand the protocol):
import socket, struct, json, sys
def asok(path, prefix):
    s = socket.socket(socket.AF_UNIX); s.connect(path)
    s.sendall(json.dumps({"prefix": prefix}).encode() + b"\0")
    n = struct.unpack(">I", s.recv(4, socket.MSG_WAITALL))[0]
    buf = b""
    while len(buf) < n: buf += s.recv(n - len(buf))
    s.close()
    if buf.startswith(b"ERROR: "): raise RuntimeError(buf[:200].decode())
    return json.loads(buf)
d = asok(sys.argv[1], "perf dump")
lat = d["osd"]["op_r_latency"]; print(lat["avgcount"], lat["sum"])The admin socket gives full access to the daemon (including config set and destructive commands). Only root or the ceph user should have access to the .asok file. Never mount the /var/run/ceph directory with write access into a monitoring container, unless it is the official ceph-exporter itself.
20-6-4 Two paths to Prometheus#
| Option | Default (main) | Path |
|---|---|---|
mgr_stats_period | 5 s | MgrClient → mgr |
mgr_stats_period_autotune | true | automatically increases the period when the mgr's message queue fills (also present in the yaml of Squid and Tentacle) |
mgr_stats_threshold | 5 | lowest priority sent to the mgr |
exporter_stats_period | 5 s | ceph-exporter |
exporter_http_port | 9926 | ceph-exporter |
exporter_prio_limit | 5 | lowest priority published by the exporter |
exporter_sock_dir | /var/run/ceph/ | where asoks are searched for |
Why ceph-exporter? In a large cluster, the mgr path passes every counter of every daemon through a single Python process, and the mgr becomes a bottleneck. ceph-exporter spreads this load across hosts. When both are active, scrape per-daemon counters from only one of them to avoid duplicate series (in cephadm, ceph-exporter is a separate service named ceph-exporter; see its status with ceph orch ls ceph-exporter).
Time accuracy#
In the worst case, the Prometheus number is older than scrape_interval plus the collection period (5 seconds). With a scrape every 15 seconds, a three-second spike may show up only as a small increase in rate(). For moment-to-moment troubleshooting, use ceph daemon osd.N perf dump or ceph tell osd.N dump_historic_ops (chapter 22) directly, not the dashboard.
ceph daemon osd.3 perf schema | jq '.osd.op_r_latency'      # type, priority, units
ceph daemon osd.3 perf dump   | jq '.osd.op_r_latency'      # avgcount, sum, avgtime
ceph daemon osd.3 counter dump | jq 'keys' | head            # labeled counters (newer versions)
curl -s localhost:9926/metrics | grep -m3 ceph_osd_op_r_latency
ceph config get mgr mgr_stats_period20-7 Monitoring in numbers: histograms, the cache and three alert rules#
This section examines five small algorithms of the monitoring stack with numbers. Two are inside Ceph itself: the two-dimensional perf counter histogram and the cache of the prometheus module in the mgr. The other three are default alert rules from the monitoring/ceph-mixin bundle, which cephadm deploys along with Prometheus. All references are to the main branch in November 2026. The text of the alert rules has changed many times across versions, so compare your own version's prometheus_alerts.yml with this text. The example numbers were computed with a Python reimplementation of the same logic. For rate() and predict_linear() in Prometheus, our implementation is an approximation of Prometheus's logic.
20-7-1 Two-dimensional latency and size histogram#
Source in code: src/common/perf_histogram.cc :: PerfHistogramCommon::get_bucket_for_axis, get_axis_bucket_ranges; src/osd/osd_perf_counters.cc :: op_hist_x_axis_config, op_hist_y_axis_config
Complexity: O(B) for B buckets per axis (B = 32); memory B_x × B_y counters
pseudocode
bucket(v, axis):
    if v < min: return 0                       # bucket zero: below min
    q = (v − min) / quant
    LINEAR: return min(q + 1, buckets − 1)
    LOG2:   for i in 1 .. buckets−1: if q < 2^(i−1): return i
            return buckets − 1                 # last bucket: anything larger
range of bucket i in LOG2: [min + 2^(i−2)·quant , min + 2^(i−1)·quant − 1]   (i ≥ 2)
hinc(latency_ns, bytes): counts[bucket_x(latency)][bucket_y(bytes)] += 1
The OSD has two histograms of this kind: op_w_latency_in_bytes_histogram and op_r_latency_out_bytes_histogram. The x axis is latency. Its label in the code is "Latency (usec)", but the input value is latency.to_nsec() and quant is 100000 nanoseconds, that is 100 microseconds. The y axis is the request size, with a quant of 512 bytes. Both axes are LOG2 with 32 buckets.
Numerical example. A write with 1.5 ms latency: q = 1500000 / 100000 = 15. The smallest i with is 5, so bucket 5, with a range of 800 to 1600 microseconds. A size of 4 KiB: q = 4096 / 512 = 8 and i = 5, that is the range 4096 to 8191 bytes. A 4 MiB write goes to bucket 15. A 64 KiB write goes to bucket 9. A latency of 150 µs is in bucket 2 (100 to 200 µs) and 30 ms in bucket 10 (25.6 to 51.2 ms). The last bucket (31) starts at seconds and in practice never fills. The whole histogram is 32 × 32 = 1024 64-bit counters, that is 8 KiB per OSD per direction.
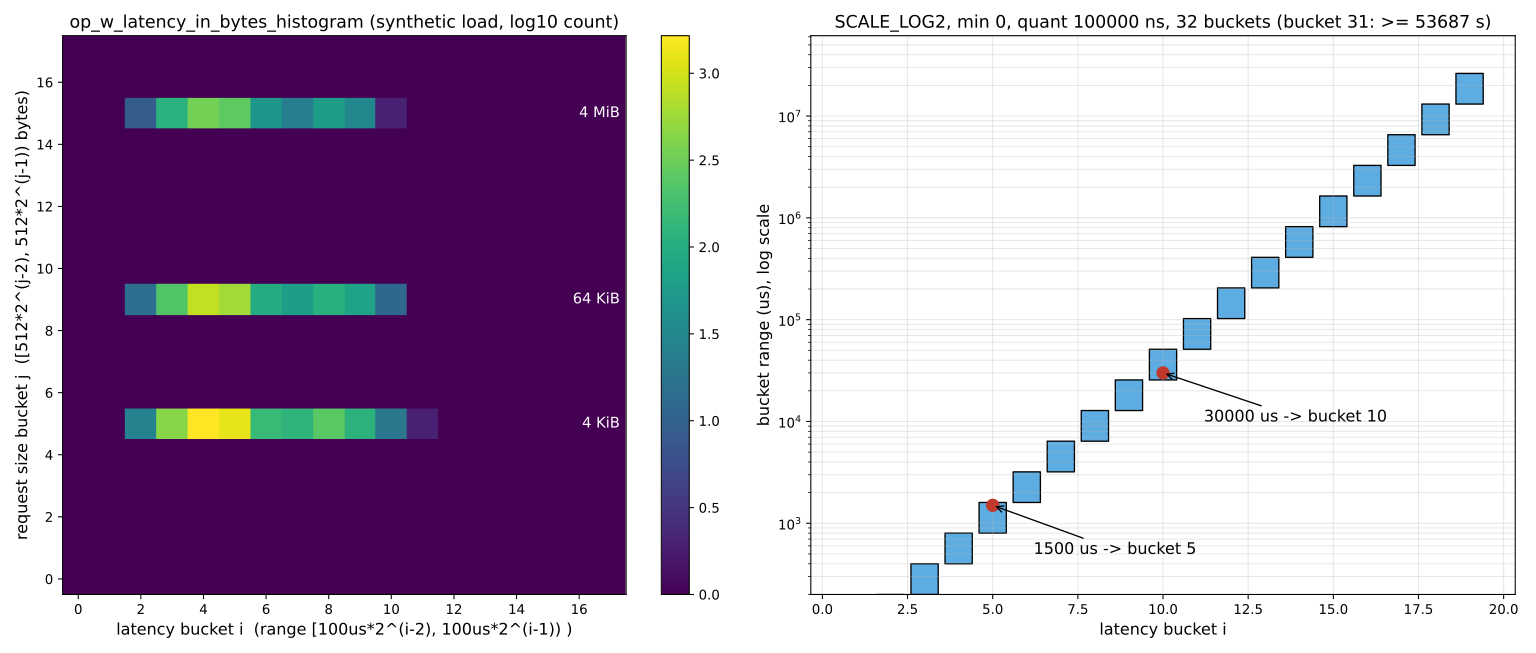
The value of this histogram compared with op_w_latency (which is only an average) is that it shows the tail of the distribution. If the average latency is 2 ms, we do not know whether all requests take 2 ms or 95 percent take 1 ms and 5 percent 20 ms. The histogram separates these and shows, row by row, which request size is slow. The histogram is read through the admin socket with ceph daemon osd.N perf histogram dump. In the main code, the prometheus module explicitly skips histogram-type counters (the code comment: "they are represented by long running avgs"). ceph-exporter also reads counters from the output of counter dump and counter schema, which is not where these histograms are. So for p99 in Prometheus you need a third-party tool or a script that reads the dump.
20-7-2 The prometheus module's cache#
Source in code: src/pybind/mgr/prometheus/module.py :: MetricCollectionThread.collect, Module.config_notify, Root.metrics
Complexity: O(1) per scrape (served from the cache); collection O(OSD + PG + pool) in a separate thread
pseudocode
collection thread (if cache = true):
    loop: start = now ; data = collect() ; d = now − start
          collect_cache = data ; collect_time = d
          sleep(max(0, scrape_interval − d))            # if d > interval: warning in the log and no sleep
config: if stale_cache_strategy ∉ {fail, return}: strategy = fail   # the option's default is "log"
GET /metrics:
    if collect_cache is empty: 503
    if collect_time < scrape_interval: 200 with the cache
    if strategy == return: 200 with the stale cache (and a log message)
    if strategy == fail: 503
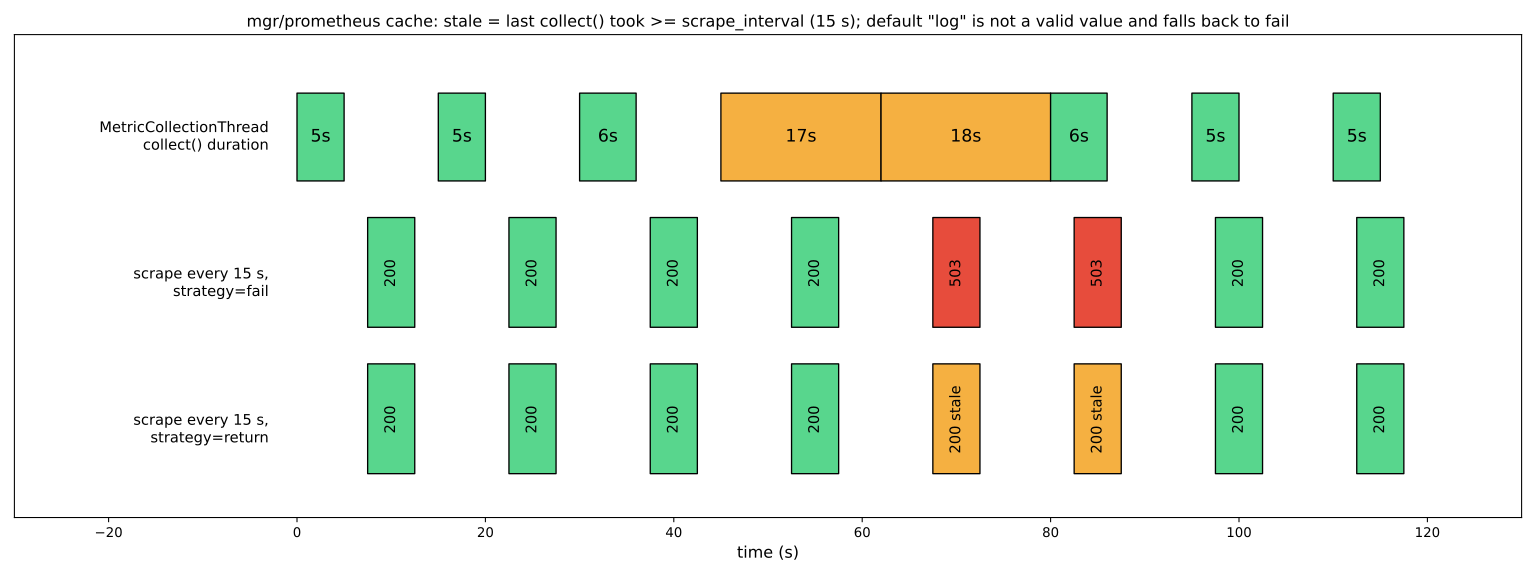
There are two lesser-known points in this code. First, "staleness" is measured by the duration of the last collection, not by the age of the cache. If the last collect() took 17 seconds and scrape_interval is 15 seconds, the cache counts as stale, even if it was updated just a second ago. Second, the default value of the stale_cache_strategy option in the option definition is "log". This value is not in the list of valid values and is turned into fail when the configuration is loaded. The documentation also says the default behaviour is a 503 response. So in practice the default is fail.
Numerical example. With scrape_interval = 15 seconds, suppose the collections take 5, 5, 6, 17, 18, 6 and 5 seconds (for example during widespread peering). The 17- and 18-second collections run back to back without sleeping. Prometheus scrapes that arrive after these two collections finish and before the next 6-second collection finishes get a 503 response in fail mode. In our simulation, two consecutive scrapes (at seconds 70 and 85) get 503. Prometheus sees up == 0 or a "target down" alert for the mgr, while the mgr is healthy and only slow. In return mode, the same two scrapes get stale data and no gap is visible in the graphs. For large clusters (the documentation mentions more than 1000 OSDs), either raise the module's scrape_interval and align it with Prometheus, or set the strategy to return.
20-7-3 The CephOSDFlapping rule#
Source in code: monitoring/ceph-mixin/prometheus_alerts.yml :: CephOSDFlapping
Complexity: O(n) for n samples in the 5-minute window per OSD
pseudocode
expr: (rate(ceph_osd_up[5m]) × on(cluster, ceph_daemon) group_left(hostname) ceph_osd_metadata) × 60 > 1
rate over samples: increase = Σ (v_i − v_{i−1} if v_i ≥ v_{i−1} , otherwise v_i)     # a 1→0 drop is a "reset" and adds 0
                   each 0→1 transition is one unit of increase
                   increase extrapolated to the window edges ; divided by 300 seconds
×60 ⇒ number of "comes up" per minute ; alert if more than 1 (no for:)
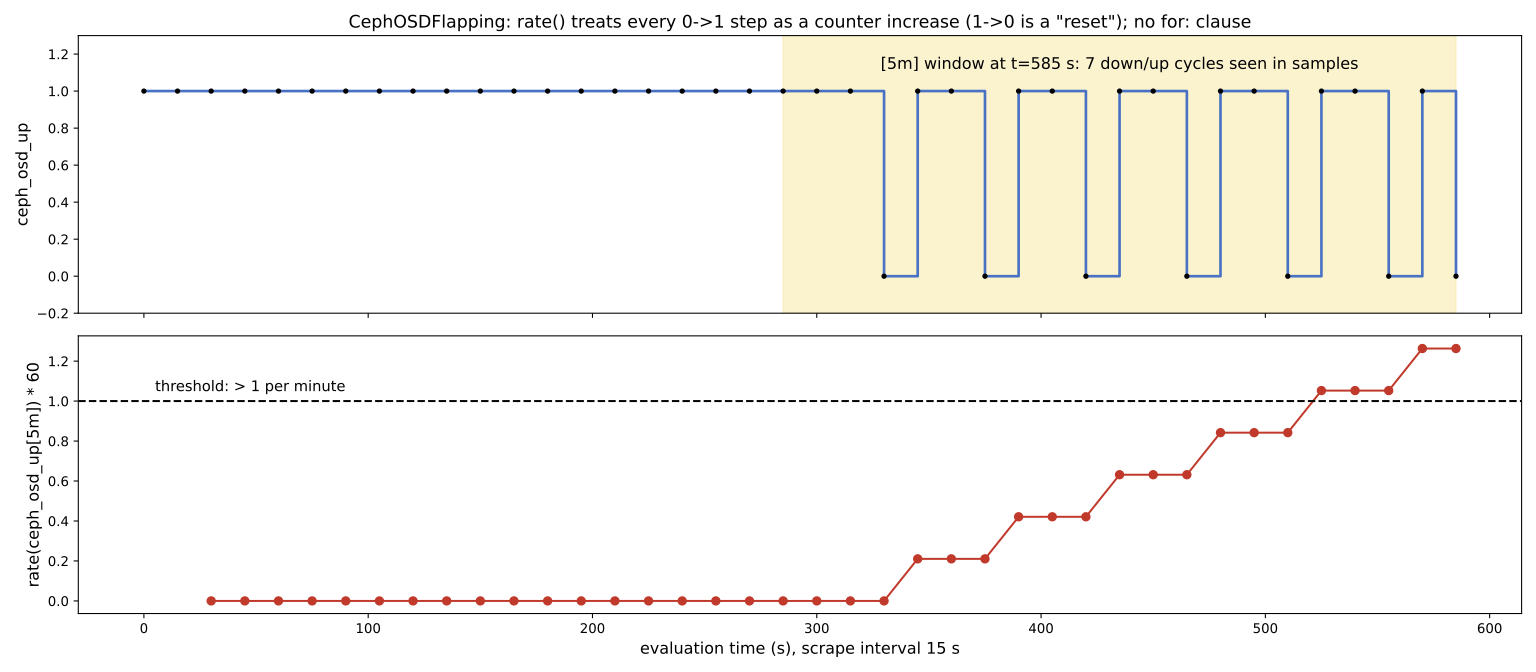
ceph_osd_up is a gauge with value 0 or 1, but the rule applies rate(), which is made for counters, to it. The result works, because rate() treats every drop as a reset and counts every rise from 0 to 1 as one unit of increase. So rate × 60 is roughly the number of times per minute the OSD came back up.
Numerical example. Prometheus samples every 15 seconds. Between seconds 330 and 585 the OSD is seen down and back up seven times (each time it is 0 in one sample). In the evaluation at second 585, the window [285, 585] has twenty samples and seven increases. Prometheus's extrapolation makes that about 7 × 300 / 285 ≈ 7.4, and rate × 60 ≈ 1.26 > 1. The alert fires immediately. It has two important limitations. First, an OSD that goes down and up between two samples (in less than 15 seconds) is not seen. Second, six flaps in five minutes may still stay below the threshold. For a more accurate view, ceph osd stat and the mon log ("wrongly marked me down" messages) are more reliable.
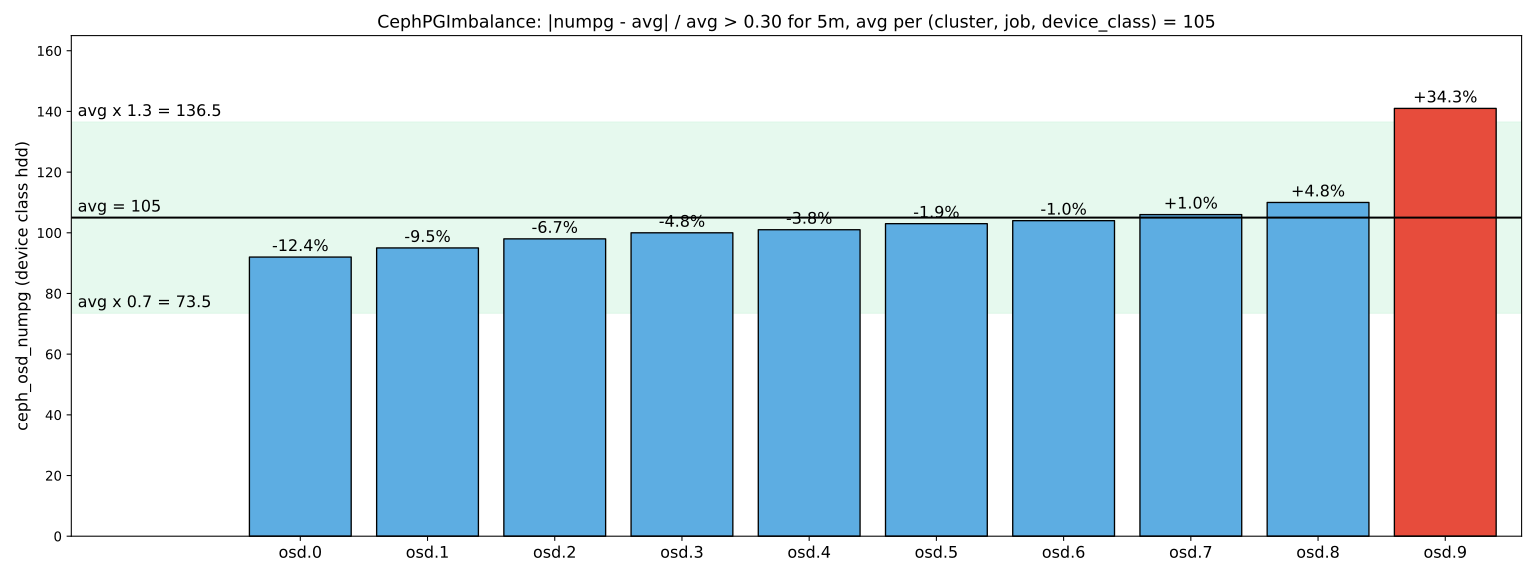
20-7-4 The CephPGImbalance rule#
Source in code: monitoring/ceph-mixin/prometheus_alerts.yml :: CephPGImbalance
Complexity: O(N) for N OSDs per evaluation
pseudocode
x_o = ceph_osd_numpg{o} (only if > 0) with the device_class label from ceph_osd_metadata
avg_c = average of x_o over OSDs of the same (cluster, job, device_class)
alert if |x_o − avg_c| / avg_c > 0.30  for 5 minutes (for: 5m)
Numerical example. Ten OSDs in the hdd class have 92, 95, 98, 100, 101, 103, 104, 106, 110 and 141 PGs respectively. The average is 105 and the allowed band is 73.5 to 136.5. osd.9 with 141 PGs is about 34.3 percent above the average and gets an alert after five minutes. osd.0, 12.4 percent below the average, is inside the band. Two points: an OSD with zero PGs (for example newly added or out) is excluded from the calculation by the > 0 filter and does not get an alert itself. Also, the 30 percent threshold is much looser than the balancer's goal. In upmap mode the balancer tries to bring each OSD's deviation from its target down to a few PGs (chapter 19). So if this alert fires, the balancer is usually off or unable to work, for example because of wrong CRUSH weights or nearly full OSDs.
20-7-5 The CephPoolGrowthWarning rule#
Source in code: monitoring/ceph-mixin/prometheus_alerts.yml :: CephPoolGrowthWarning; Prometheus :: predict_linear
Complexity: O(n) for n samples in the 2-day window
pseudocode
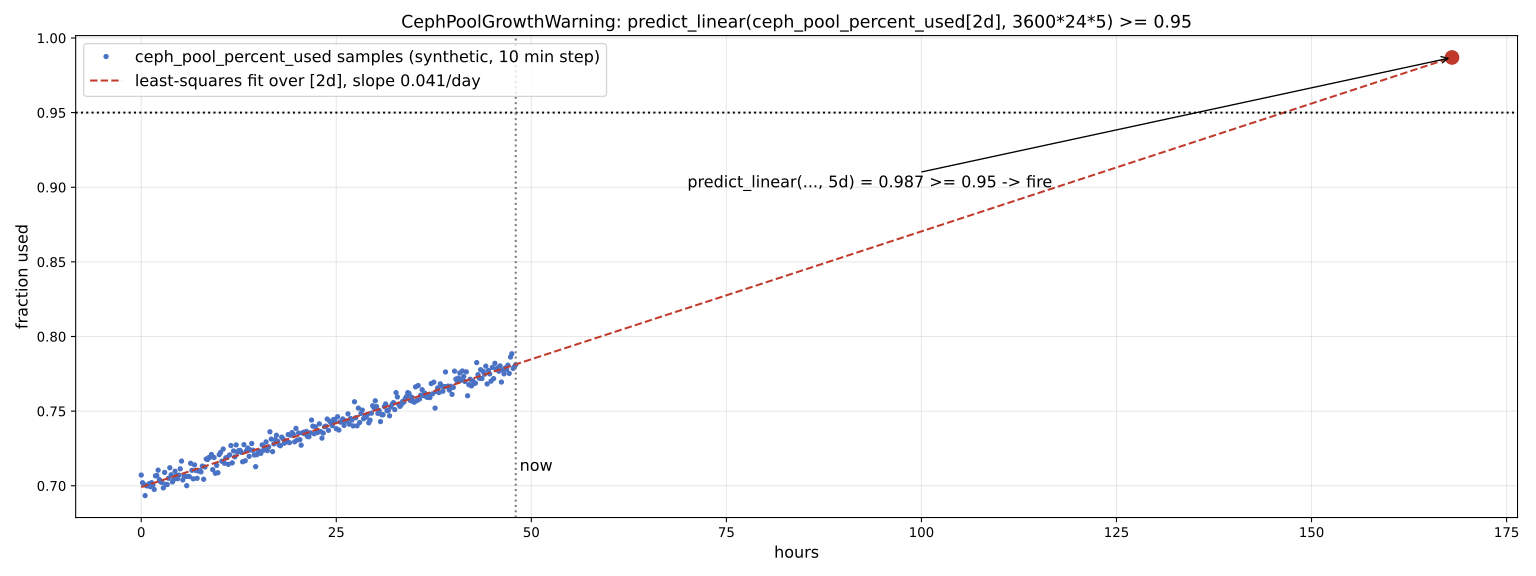
expr: (predict_linear(ceph_pool_percent_used[2d], 3600 × 24 × 5) × on(cluster, pool_id, instance) group_right() ceph_pool_metadata) ≥ 0.95
predict_linear: (a, b) = least squares over the samples of the past 48 hours, with t relative to the evaluation time
                output a + b × 432000                       # the predicted value 5 days later
alert if output ≥ 0.95 (no for:)
Numerical example. Over the past two days the pool went from 70 percent to 78 percent, that is a slope of 0.04 per day. Samples were taken every 10 minutes. Without noise, the prediction for 5 days later is 0.78 + 5 × 0.04 = 0.98, which is above 0.95, and the alert fires. With synthetic noise (standard deviation 0.004) the output was 0.987. The alert means "at this trend, the pool will be full in five days", not that it is full now. Conversely, if sudden growth happened in the last two hours, the regression over 48 hours dilutes it and the alert comes late. Note that ceph_pool_percent_used depends on max_avail. max_avail is computed from the fullest OSD under that pool's CRUSH rule. So data imbalance raises percent_used and makes this alert fire earlier.
20-8 mgmt-gateway: a single front door#
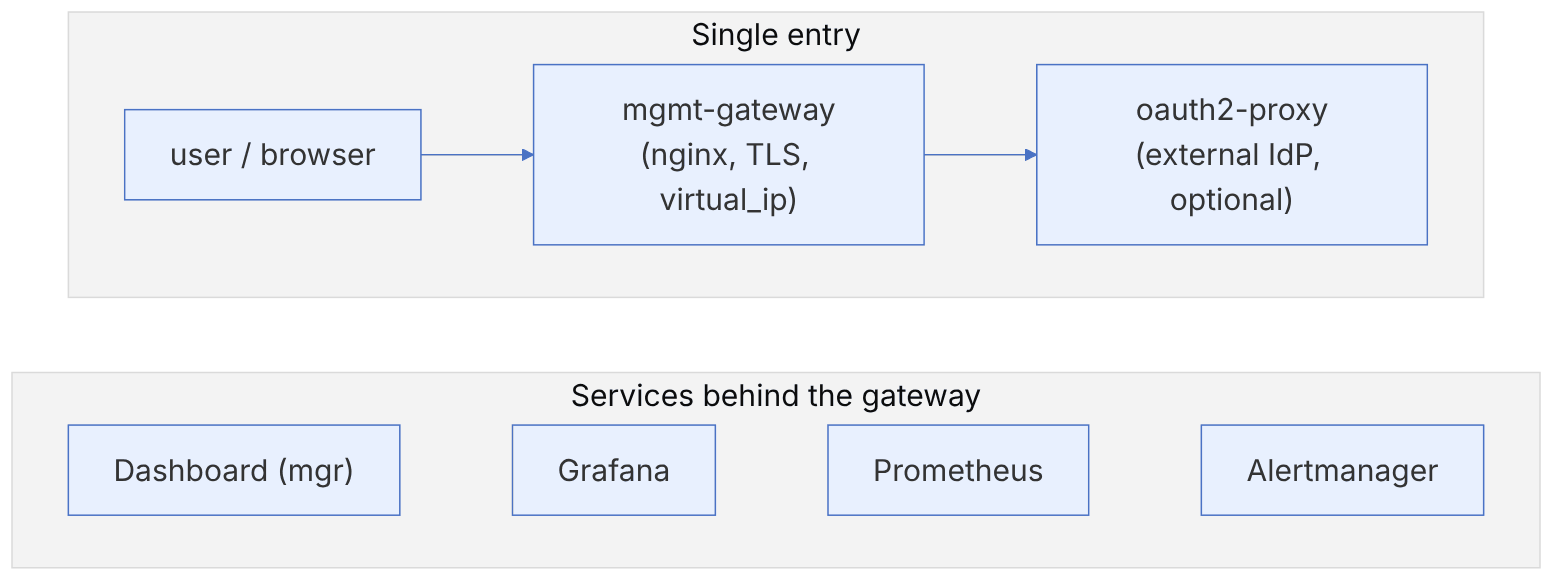
In deployments before Tentacle, the Dashboard, Grafana, Prometheus and Alertmanager each had their own port and certificate, and users needed access to several addresses. mgmt-gateway (an nginx-based cephadm service) puts them all behind a single entry point with TLS, and with oauth2-proxy it can delegate authentication to an external IdP (OIDC).
ceph orch apply mgmt-gateway --placement="label:mgmt"
# with a virtual address and authentication (per the mgmt-gateway documentation)
ceph orch apply mgmt-gateway --virtual_ip 192.0.2.50 --enable-auth=true --placement="label:mgmt"
ceph orch apply oauth2-proxy -i oauth2-proxy.yaml
ceph orch ls | grep -E "mgmt-gateway|oauth2"According to the documentation, the virtual_ip address in mgmt-gateway must be a plain IP, and for high availability it is used together with an ingress service with the same IP (with a network prefix); oauth2-proxy is stateless and can have several instances. After the gateway is deployed, the monitoring stack endpoints (including service discovery) become secure (https).
Do not expose Prometheus and Alertmanager directly to the users' network: the monitoring documentation points out that Prometheus's security model assumes untrusted users have access to the endpoint and the data, and its read-only API reveals all collected (meta)data. A gateway or firewall is necessary.
20-9 Logs and events#
- Cluster log in the MON:
ceph log last 200, and live following withceph -w; the cephadm channel withceph -W cephadm. - Daemon logs in cephadm go to journald:
cephadm logs --name osd.3orjournalctl -u ceph-<fsid>@osd.3; to write to a file,ceph config set global log_to_file true. - Crashes are collected by the crash module and appear in the RECENT_CRASH warning;
ceph crash ls,ceph crash info <id>,ceph crash archive-all. - telemetry (optional and opt-in): sends anonymous statistics to the project; preview with
ceph telemetry preview(chapter 9).
For centralized log collection, send the hosts' journald to the central system with your organization's tool of choice (for example a log collection agent) and keep the fsid and daemon name labels, so you can line up logs with metrics and alerts.
20-10 Dashboards and SLOs#
The ceph-mixin dashboards (cluster, host, OSD, pool, RGW, RBD, CephFS) are deployed with Grafana. For running a service, build a few service-level views in addition to them:
| SLI | Example definition | Source |
|---|---|---|
| RBD availability | percentage of time all of the pool's PGs are active | ceph_pg_active / ceph_pg_total for the pool |
| Write latency | 99th percentile of OSD or client write latency | ceph-exporter (and librbd counters if enabled) |
| S3 availability | ratio of non-5xx responses in RGW | the RGW access log or rgw counters |
| Mirroring RPO | difference between local and remote image timestamps | ceph_rbd_mirror_snapshot_* metrics |
- Deploy the monitoring stack with cephadm and enable ceph-exporter on all hosts.
- Define all mgrs or service discovery for scraping so that a failover does not create a blind spot.
- Compute average latency from the ratio of the counters' rates, not from the raw value.
- Pair local rules with a runbook and take thresholds from real behaviour.
- Keep Prometheus and Alertmanager behind mgmt-gateway or a firewall.
20-11 Supplementary and up to date#
- Moving perf counters from the prometheus module to ceph-exporter (the
exclude_perf_countersdefault) is the most important change in monitoring architecture since 2019; in those years monitoring relied mostly on Calamari and third-party tools, which today have given way to the Dashboard and the Prometheus stack. - mgmt-gateway and oauth2-proxy arrived in Tentacle.
- Hardware rules (power supply, cooling, NVMe) and NVMe-oF rules have been added to ceph-mixin.
20-12 Hands-on exercise#
- 1. Deploy the monitoring stack with cephadm and see all targets healthy on the Prometheus Targets page.
- 2. With
ceph daemon osd.N counter dumpandcurlon the ceph-exporter port, compare one counter in both forms. - 3. Add the CephWriteLatencyHigh rule and trigger it with
tc netemon the cluster network. - 4. Write an inhibit rule for CephOSDHostDown and CephOSDDown and test it by shutting down a host.
- 5. Move the active mgr with
ceph mgr failand check the continuity of the time series. - 6. Deploy mgmt-gateway and block direct access to the Prometheus port with a firewall.
20-13 Review questions#
- 1. Why were perf counters moved from the prometheus module to ceph-exporter?
- 2. Why should all mgrs or service discovery be defined for scraping?
- 3. How are a counter's priority and exporter_prio_limit related?
- 4. How is the average latency of an interval computed from a time_avg counter?
- 5. What is the ceph_health_detail metric used for?
- 6. What is the role of for in an alert rule?
- 7. What problem does inhibit in Alertmanager solve?
- 8. What are the advantages of mgmt-gateway?
- 9. Why should Prometheus not be directly exposed to users?
- 10. Name a few suitable SLIs for an RBD service.
Answers to these questions are in Appendix E: Answers to Review Questions. Answers to this chapter's questions →
20-14 Sources for this chapter#
- Monitoring overview
https://docs.ceph.com/en/latest/monitoring/ - cephadm monitoring services
https://docs.ceph.com/en/latest/cephadm/services/monitoring/ - Prometheus manager module
https://docs.ceph.com/en/latest/mgr/prometheus/ - mgmt-gateway
https://docs.ceph.com/en/latest/cephadm/services/mgmt-gateway/ - oauth2-proxy
https://docs.ceph.com/en/latest/cephadm/services/oauth2-proxy/ - Ceph Dashboard
https://docs.ceph.com/en/latest/mgr/dashboard/ - Crash module
https://docs.ceph.com/en/latest/mgr/crash/ - ceph-mixin alerts
https://github.com/ceph/ceph/blob/main/monitoring/ceph-mixin/prometheus_alerts.yml - Source: src/common/perf_counters.h
https://github.com/ceph/ceph/blob/main/src/common/perf_counters.h - Source: src/common/options/ceph-exporter.yaml.in
https://github.com/ceph/ceph/blob/main/src/common/options/ceph-exporter.yaml.in - Prometheus security model
https://prometheus.io/docs/operating/security/