Ceph Performance Tuning: From mClock to the Kernel and Network
TL;DR this chapter in a few lines
- Check the basics first: network saturation, the block.db device and CPU power saving solve most performance problems.
- The OSD spreads PGs over shards and threads; mClock (the default scheduler since Quincy) shares capacity between client I/O, recovery and scrub.
osd_memory_target(4 GiB by default) is the per-OSD memory budget that BlueStore's cache autotuning follows.- Tune the OS, network (consistent MTU) and CPU, and always report latency percentiles (p99, p99.9), not just averages.
21-1 Before you start#
21-1-1 What questions does this chapter answer?#
Performance tuning in Ceph is above all a method: define the goal, take a baseline, make one change and measure again. Many of the common "tuning tips" on the internet relate to FileStore, WPQ or versions before Quincy, and today they are either ineffective or harmful. This chapter focuses on today's mechanisms:
- What are the performance layers, and where do we start?
- How does the OSD spread requests across shards and threads?
- With what algorithm does the mClock scheduler balance client and recovery, and what do the profiles do?
- How do we tune OSD memory and the BlueStore cache?
- What are the operating system, network and CPU settings?
- How do we measure with fio, rados bench and CBT?
21-2 Method and layers#

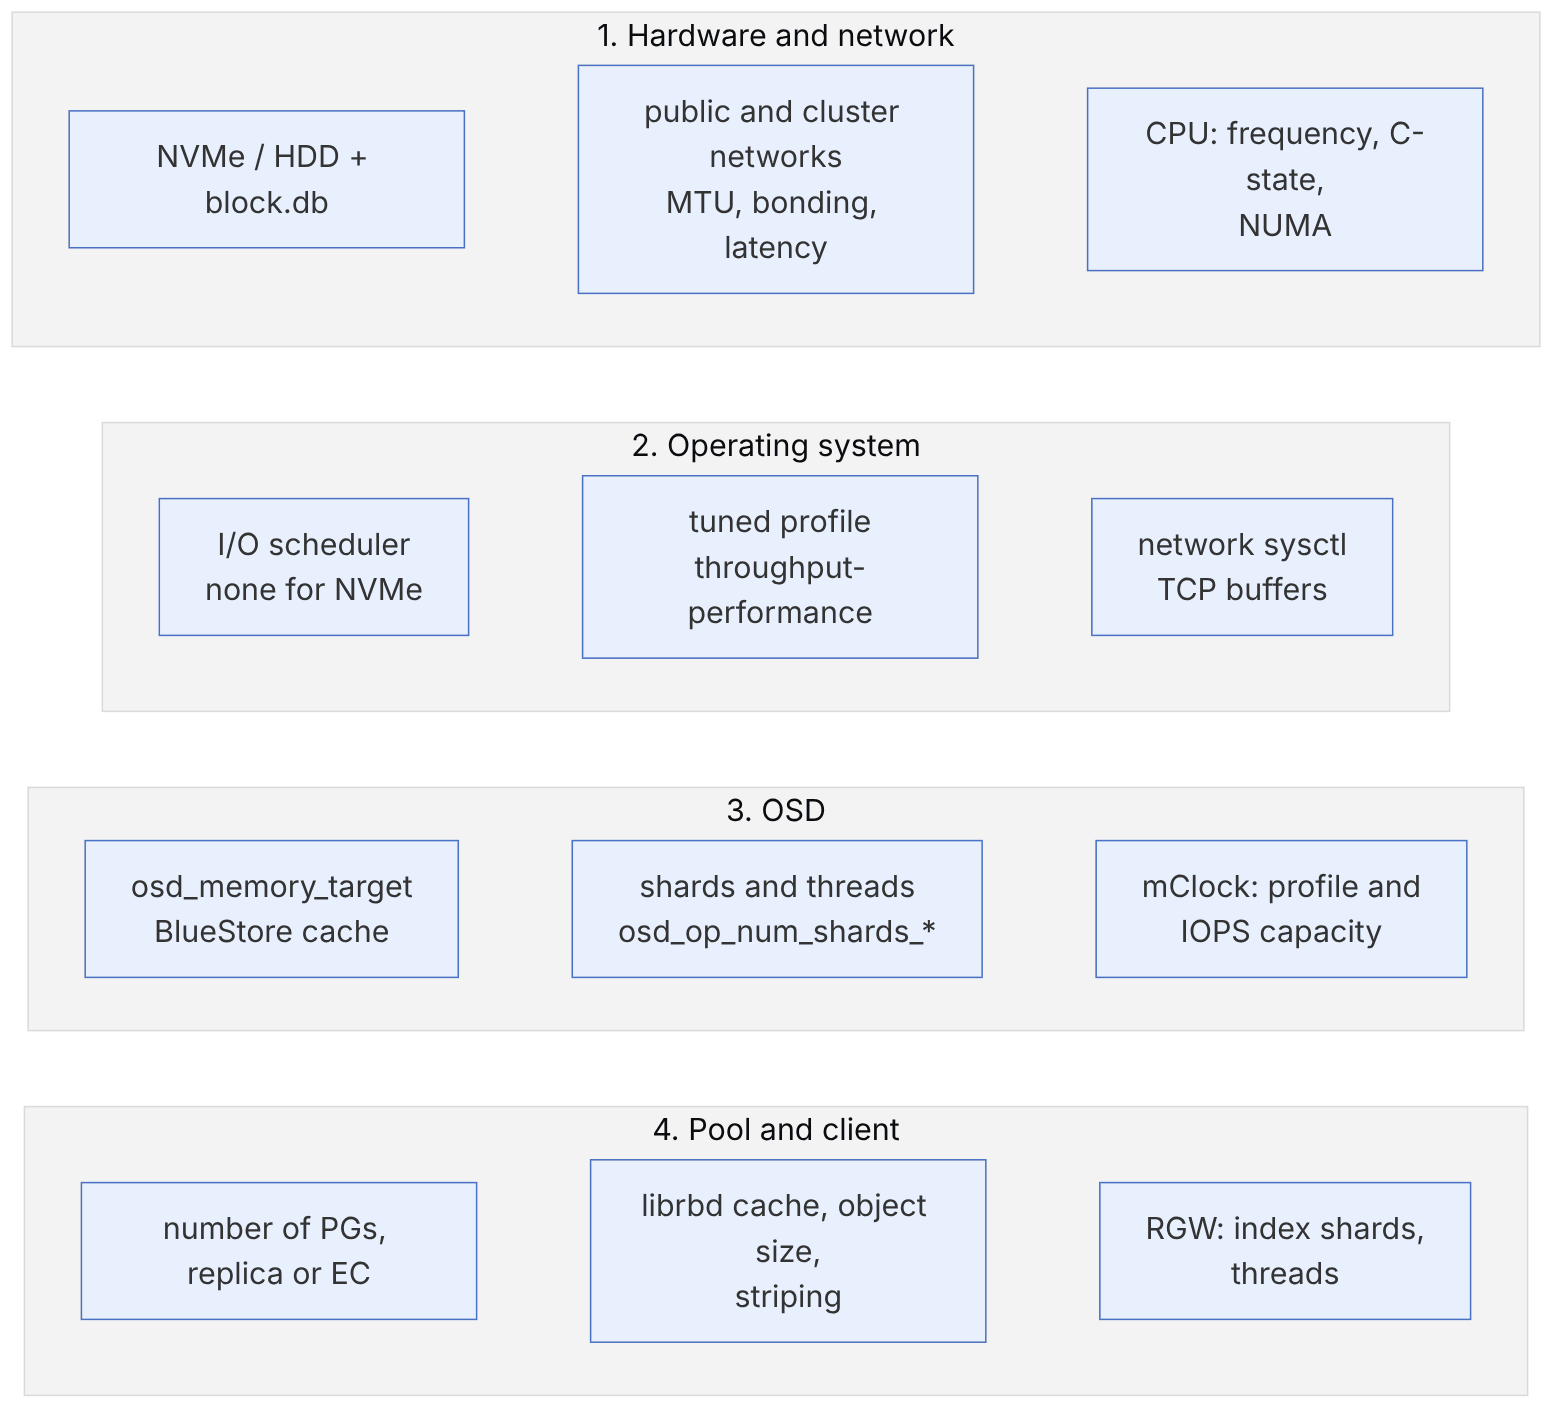
Before any software tuning, answer three questions: Is the cluster network saturated? Are the disks (especially block.db) the bottleneck? Is the CPU in power-saving mode? In practical experience, most performance problems are solved by answering these three questions.
21-3 From inside the code: shards and threads#
21-3-1 The request path in the OSD#
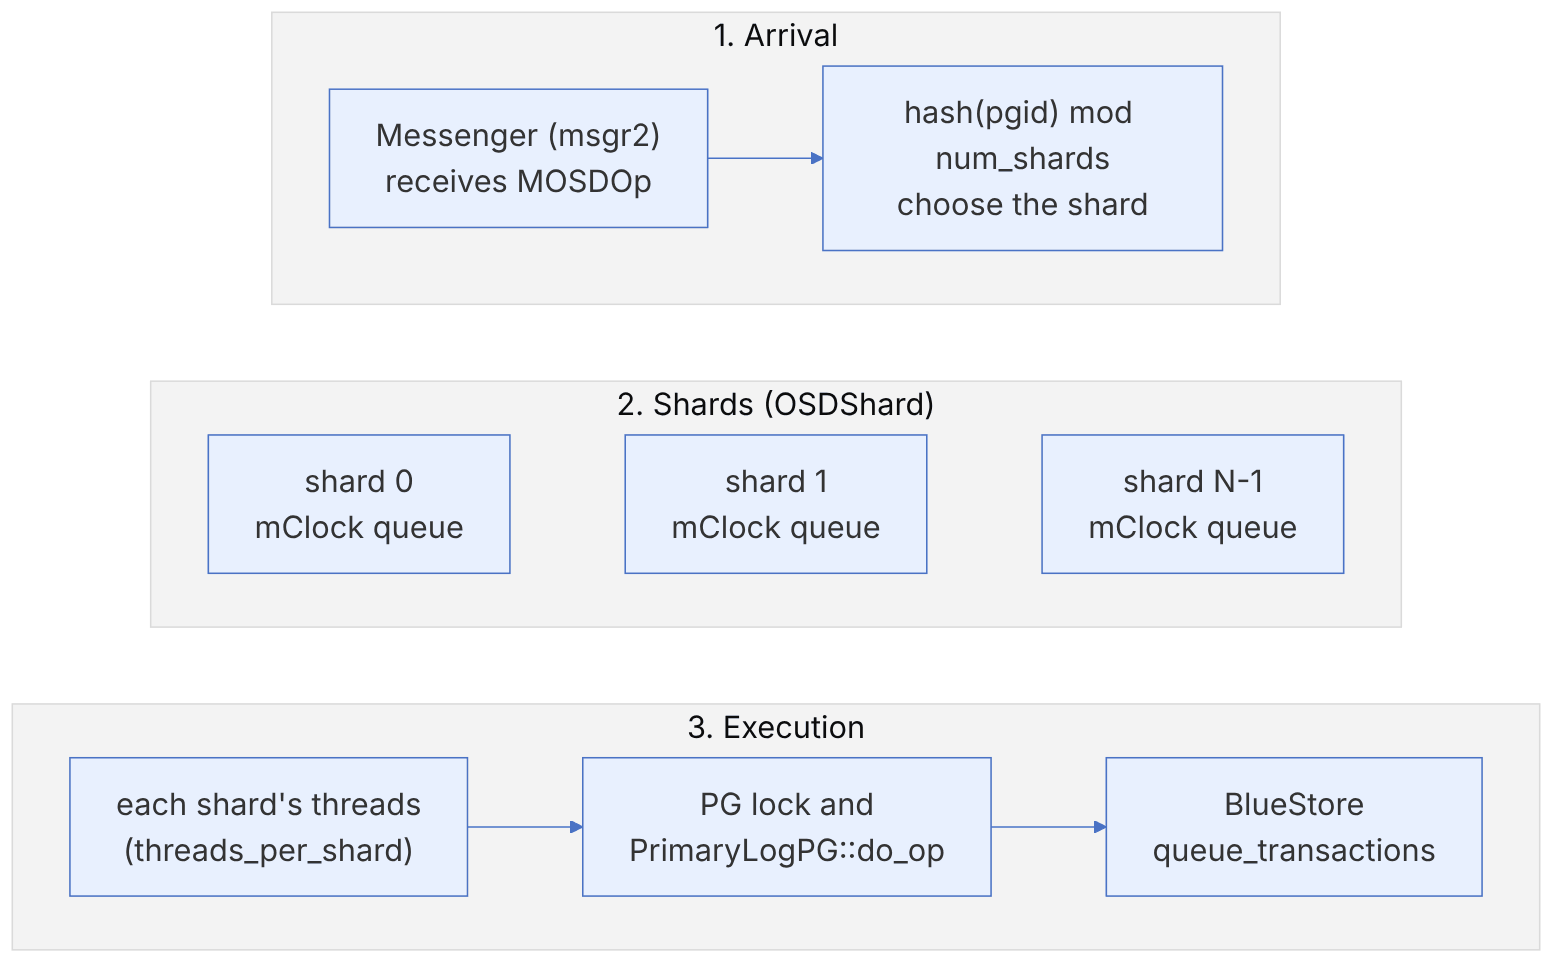
The OSD spreads requests across several shards (struct OSDShard in src/osd/OSD.h). The shard of each PG is determined by pgid.hash_to_shard(num_shards); so all operations of a PG are always processed in one shard and ordering is preserved. Each shard has its own scheduling queue and several threads.
| Option | Default since v19.2.1 (Squid) and in Tentacle and Umbrella | Default in v19.2.0 |
|---|---|---|
| osd_op_num_shards_hdd | 1 | 5 |
| osd_op_num_threads_per_shard_hdd | 5 | 1 |
| osd_op_num_shards_ssd | 8 | 8 |
| osd_op_num_threads_per_shard_ssd | 2 | 2 |
Version-dependent. The values in the table were read from src/common/options/osd.yaml.in at tags v19.2.0 to v19.2.3, v20.2.0 and v21.2.0. For HDD, one shard with five threads has replaced five single-threaded shards. This change also reached Squid in point release v19.2.1, so only v19.2.0 has the old value. The rationale: with one shard, the mClock scheduler has a complete view of all requests on that OSD and can honour client and recovery reservations and shares more precisely; with several shards, each shard sees only part of the capacity. These options only take effect after the OSD is restarted.
Blindly increasing shards or threads on fast NVMe often only raises CPU usage and lock contention. If neither the CPU nor the disk is saturated, the bottleneck is probably elsewhere (the network, the client, or a hot PG).
21-4 From inside the code: mClock#
21-4-1 The dmClock algorithm#
Since Quincy, the OSD's default scheduler is mclock_scheduler (osd_op_queue). This scheduler is based on the dmclock library (src/dmclock/), which implements the mClock algorithm. Each service class has three parameters:
- reservation: the guaranteed minimum share (IOPS),
- weight: the relative share of spare capacity,
- limit: the share ceiling.
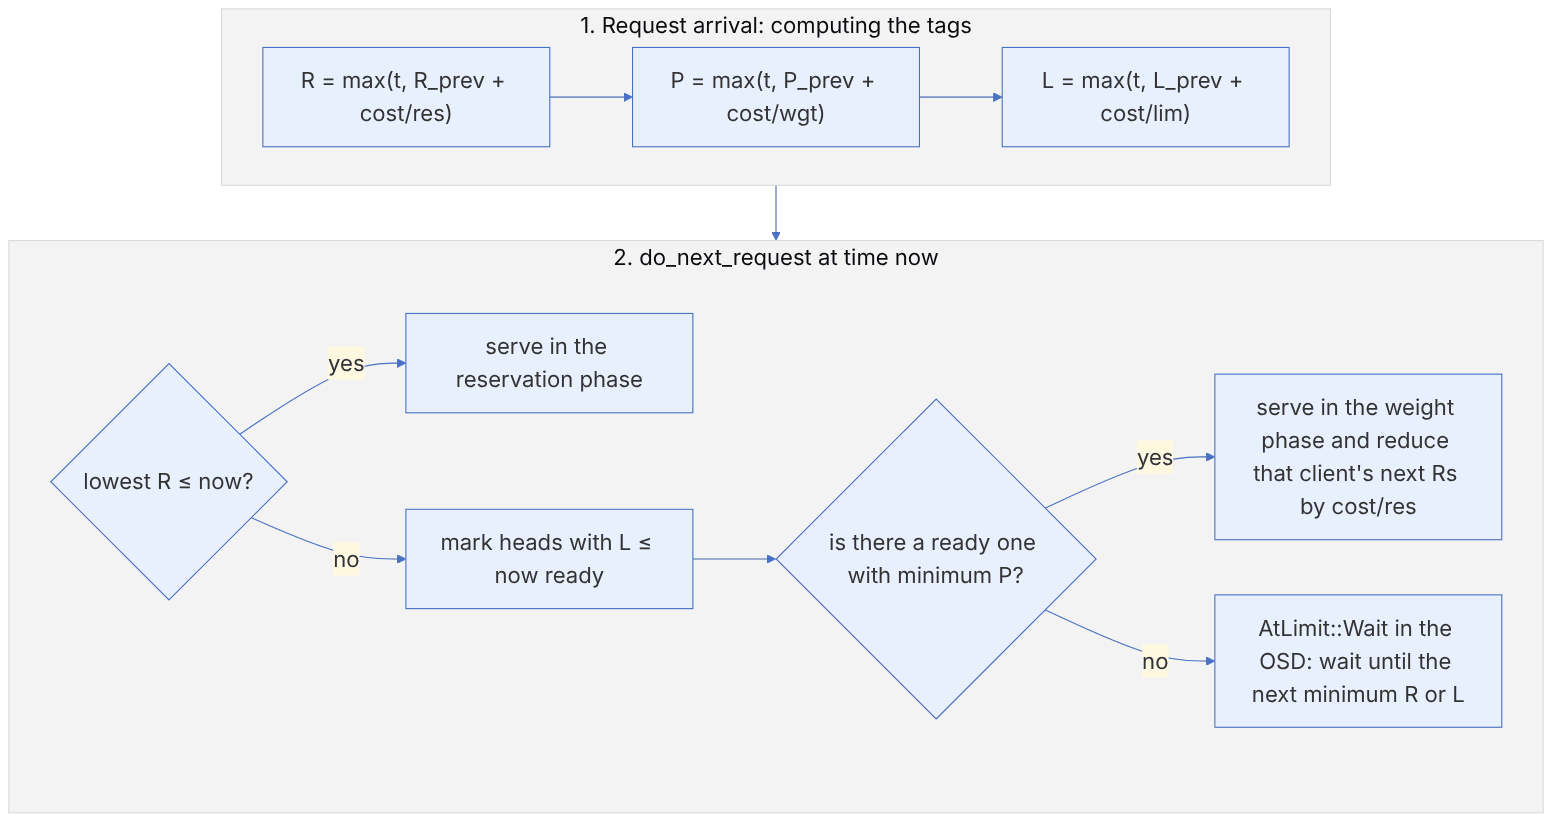
Each request gets three time tags (R, P, L). Tag computation in dmclock:
// from ceph/ceph, LGPL — src/dmclock/src/dmclock_server.h, RequestTag::tag_calc (excerpt)
if (0.0 == increment) {
  return extreme_is_high ? max_tag : min_tag;
} else {
  double tag_increment = increment * (uint64_t(dist_req_val) + cost);
  return std::max(time, prev + tag_increment);
}
increment is the inverse of the parameter (1/reservation, 1/weight or 1/limit) and cost is the request's cost. So a class with a larger reservation gets R tags closer together and its requests become "due" sooner. max(time, ...) ensures that a class that has been idle for a while does not have "accumulated credit" from old tags.
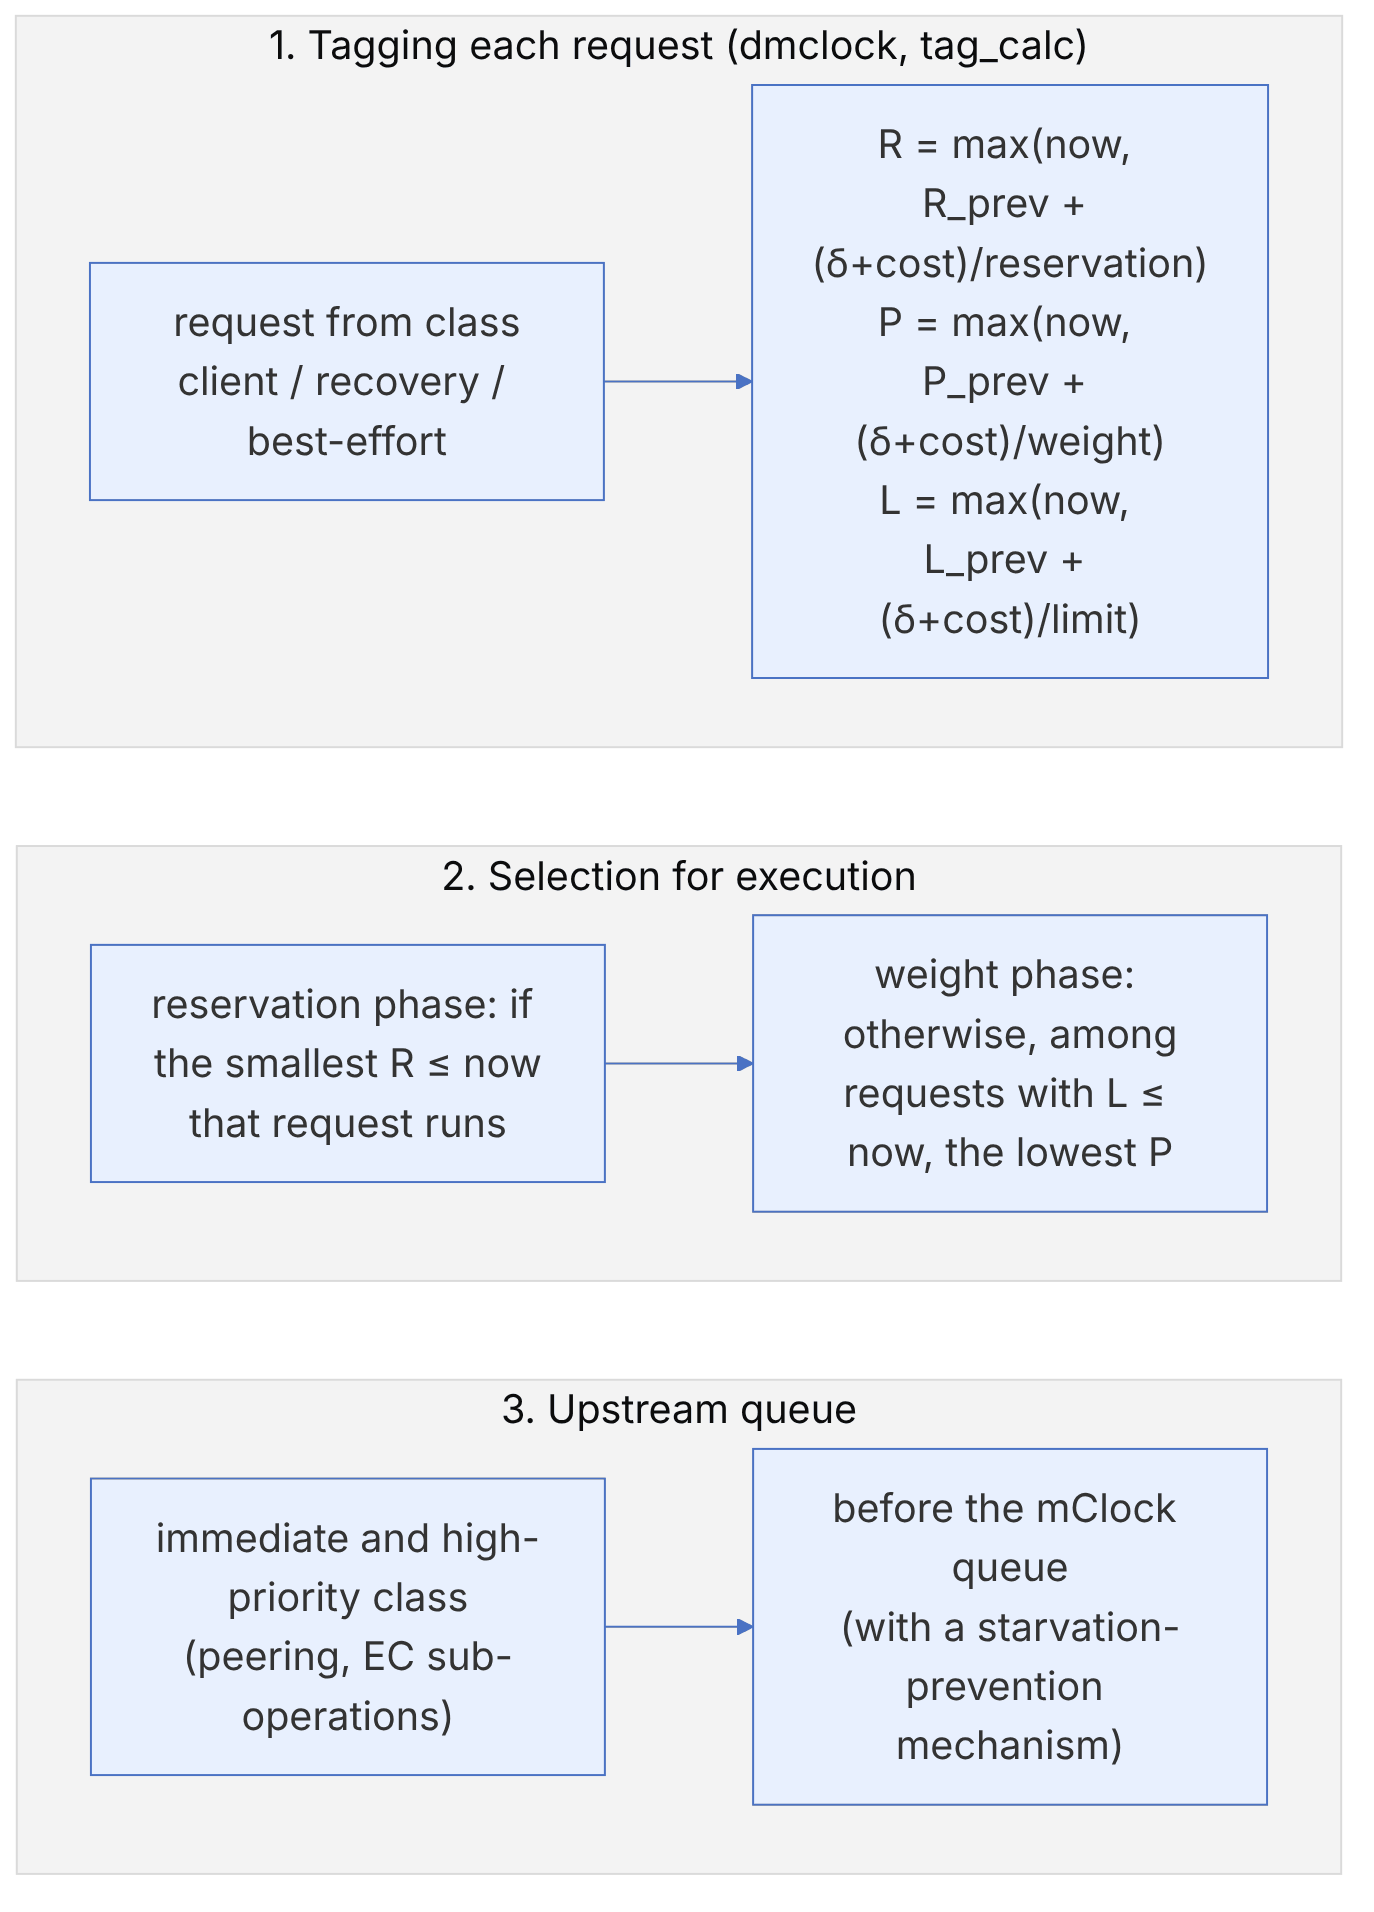
pseudocode: choosing the next request (this book's summary of dmclock)
  now = clock()
  r = queue.min_by(R)
  if r.R <= now:            return r            # reservation phase: guarantee the minimums
  eligible = [q for q in queue if q.L <= now]   # have not exceeded their limit
  if eligible:              return eligible.min_by(P)   # share spare capacity by weight
  return none               # all have reached their limit → wait until due
21-4-2 Profiles#
An mClock profile sets the parameters of the three classes (client, background recovery, background best-effort) as percentages of the OSD's capacity. The values below are from the mClock Config Reference page of the latest documentation:
| Profile | client (R / W / L) | recovery (R / W / L) | best-effort (R / W / L) |
|---|---|---|---|
| balanced (default) | 50% / 1 / MAX | 50% / 1 / MAX | 5% / 2 / 90% |
| high_client_ops | 60% / 2 / MAX | 40% / 1 / MAX | 5% / 4 / 70% |
| high_recovery_ops | 30% / 1 / MAX | 70% / 2 / MAX | 5% / 2 / MAX |
| custom | manual | manual | manual |
ceph config get osd osd_mclock_profile
ceph config set osd osd_mclock_profile high_client_ops      # peak hours
ceph config set osd osd_mclock_profile high_recovery_ops    # fast recovery at night
ceph config show osd.0 | grep -E "osd_mclock_max_capacity_iops|osd_mclock_scheduler"For capacity, mClock needs each OSD's IOPS figure. When the OSD starts, if osd_mclock_max_capacity_iops_[hdd|ssd] has its default value and osd_mclock_skip_benchmark is off, the OSD runs an internal benchmark (per the code comment in OSD.cc: writing 100 4-megabyte objects with a 4-kilobyte block). If the result falls outside the threshold range (for HDD between 50 and 500, for SSD between 1000 and 80000; the osd_mclock_iops_capacity_[low_]threshold_* options), the result is discarded and the default value (315 for HDD and 21500 for SSD) is used.
In the built-in profiles, mClock manages recovery settings such as osd_max_backfills and osd_recovery_max_active itself, and changing them directly is ignored unless you enable osd_mclock_override_recovery_settings (default false). Also, according to the documentation, with any mClock profile active (even custom), the old sleep options such as osd_recovery_sleep are disabled (zero). This is one of the most common confusions after upgrading from WPQ versions: "I raised osd_max_backfills but the backfill speed didn't change."
The immediate queue: some requests (such as peering and EC sub-operations between shards) are processed before the mClock queue and independently of its parameters. The latest documentation explains that under sustained heavy load this queue could stay full forever and the mClock queue would never get a turn; in an EC pool this led to complete starvation of best-effort work such as deep-scrub (tracker number 69078), and a starvation-prevention mechanism has been added for it. If you are on an older version and deep scrub falls behind in a busy EC pool, keep this issue in mind.
21-5 OSD memory#
osd_memory_target (default 4 gigabytes) is the memory usage target of each OSD, and BlueStore, with bluestore_cache_autotune (default true), tunes the onode, data and RocksDB caches within this budget (chapter 12). In cephadm, according to the OSD documentation, osd_memory_target_autotune is enabled by default for new OSDs, and cephadm sets each OSD's target from the host's memory times mgr/cephadm/autotune_memory_target_ratio (default 0.7 in the cephadm code), minus the memory of other daemons, divided by the number of OSDs.
ceph config get osd osd_memory_target
ceph orch host ls --detail                     # host memory
ceph config set osd/host:stor-a1 osd_memory_target 8G
ceph daemon osd.3 dump_mempools | jq '.mempool.by_pool | to_entries | sort_by(-.value.bytes) | .[0:5]'For NVMe OSDs with a heavy metadata load (RGW with small objects, CephFS), more memory (8 to 16 gigabytes) has a noticeable effect, because more onodes stay in the cache. For HDD, the default is usually enough and the bottleneck is the disk itself.
21-6 The lower layer: the memory control loop and throttle in BlueStore#
Two less-noticed control loops determine a large part of an OSD's performance behaviour. The first matches cache memory to actual heap usage. The second determines how many concurrent transactions can enter BlueStore. Both are a few simple lines in the code, but their effect at cluster level is large.
21-6-1 How is osd_memory_target applied?#
osd_memory_target is not a hard limit; it is the target of a control loop. The BlueStore memory thread (MempoolThread) first computes the cache budget bounds (in BlueStore.cc), and then PriorityCache::Manager::tune_memory pushes the budget toward the target on each round.
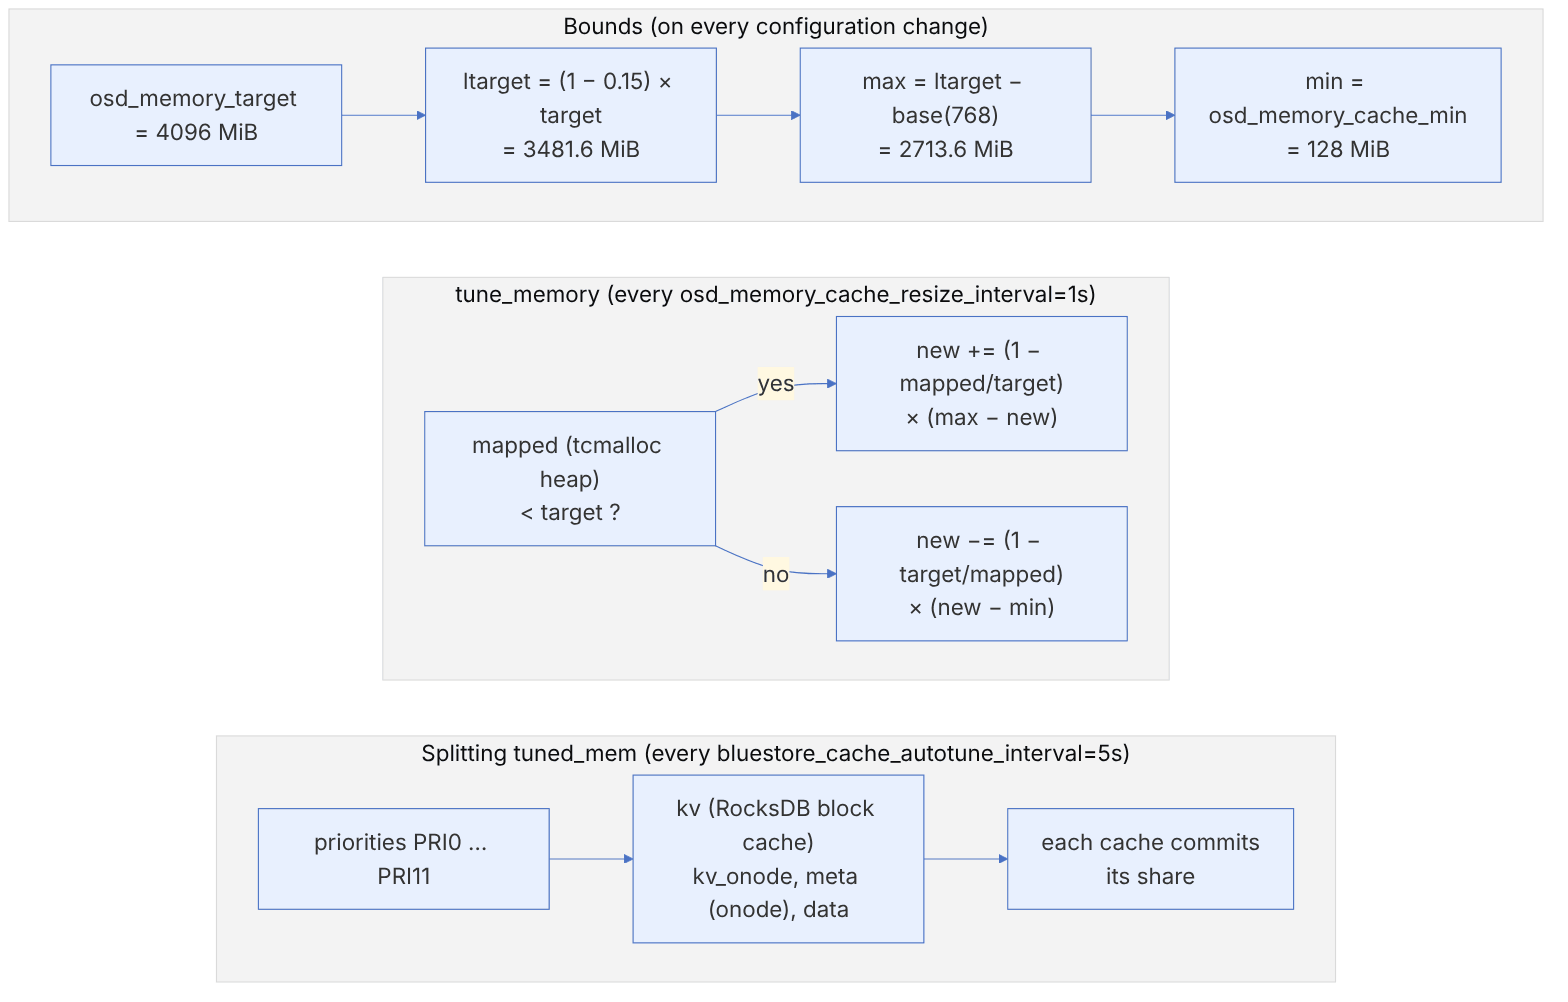
pseudocode: bounds and one tune_memory step (this book's rewrite)
  ltarget = (1 - expected_fragmentation) * target
  min     = cache_min
  max     = ltarget - base     if ltarget > base + min   else min
  new     = clamp(tuned, min, max)
  if mapped < target:  new += (1 - mapped/target) * (max - new)   # growth, slower when near the target
  else:                new -= (1 - target/mapped) * (new - min)   # shrink in proportion to the overuse
  tuned = new
Numerical example with the defaults#
With osd_memory_target=4G, osd_memory_base=768M, osd_memory_cache_min=128M and osd_memory_expected_fragmentation=0.15:
| Step | Input | Computation | Result |
|---|---|---|---|
| bound | target=4096 MiB | 0.85×4096 | ltarget=3481.6 MiB |
| bound | base=768 | 3481.6−768 | max=2713.6 MiB and min=128 MiB |
| step 1 | tuned=1500, mapped=3000 | r=1−3000/4096=0.2676; 1500+0.2676×(2713.6−1500) | 1824.7 MiB |
| step 2 | mapped=4500 (overuse) | r=1−4096/4500=0.0898; 1824.7−0.0898×(1824.7−128) | 1672.4 MiB |
Three practical conclusions follow from this example:
- 1. The cache never gets the whole target. Even in the best case, about 2.7 GiB of the 4 GiB goes to the cache. The rest is the share of base (non-cache memory such as the pg log, connections and buffers) and the fragmentation margin.
- 2. The reaction to overuse is gradual. With 10% overuse, the budget shrinks by only about 9% of the distance to min. If something outside the cache grows (for example a very long pg log during backfill), RSS can stay above target for a while. Plan the host's memory headroom accordingly to avoid OOM.
- 3.
mappedis read from tcmalloc. If the OSD is built with another allocator, this loop effectively does not work, and the fixed cache sizebluestore_cache_size_hdd/ssd(1G and 3G respectively) becomes meaningful.
To see the loop in action: ceph daemon osd.N dump_mempools shows the memory of each mempool (chapter 23), and the prioritycache counters in perf dump (such as target_bytes, mapped_bytes and heap_bytes) show the state of the loop. If mapped_bytes is constantly above target_bytes, the problem is not in the cache. Look for a consumer outside the cache.
Splitting the budget between caches is prioritized (PRI0 to PRI11 in PriorityCache.h). Each cache requests at each priority, and the manager starts allocating from the highest priority. The ratios bluestore_cache_kv_ratio=0.45, bluestore_cache_meta_ratio=0.45 and bluestore_cache_kv_onode_ratio=0.04 are only a starting point. With bluestore_cache_autotune=true, the actual share shifts based on each cache's requests. Usually hot onodes and RocksDB's index and filter blocks come ahead of user data.
21-6-2 The throttle at the BlueStore entrance#
Before entering BlueStore, each transaction (TransContext) takes a "cost" from throttle_bytes, which is capped at bluestore_throttle_bytes=64M. The cost is not just the data volume. _txc_calc_cost computes the cost like this:
ios  = 1 + (number of data aios)        # one for the kv commit
cost = ios × throttle_cost_per_io + bytes
The value of throttle_cost_per_io is 670000 for HDD and 4000 for SSD, unless bluestore_throttle_cost_per_io is set explicitly. This number is in effect the "byte equivalent" of the cost of one seek.
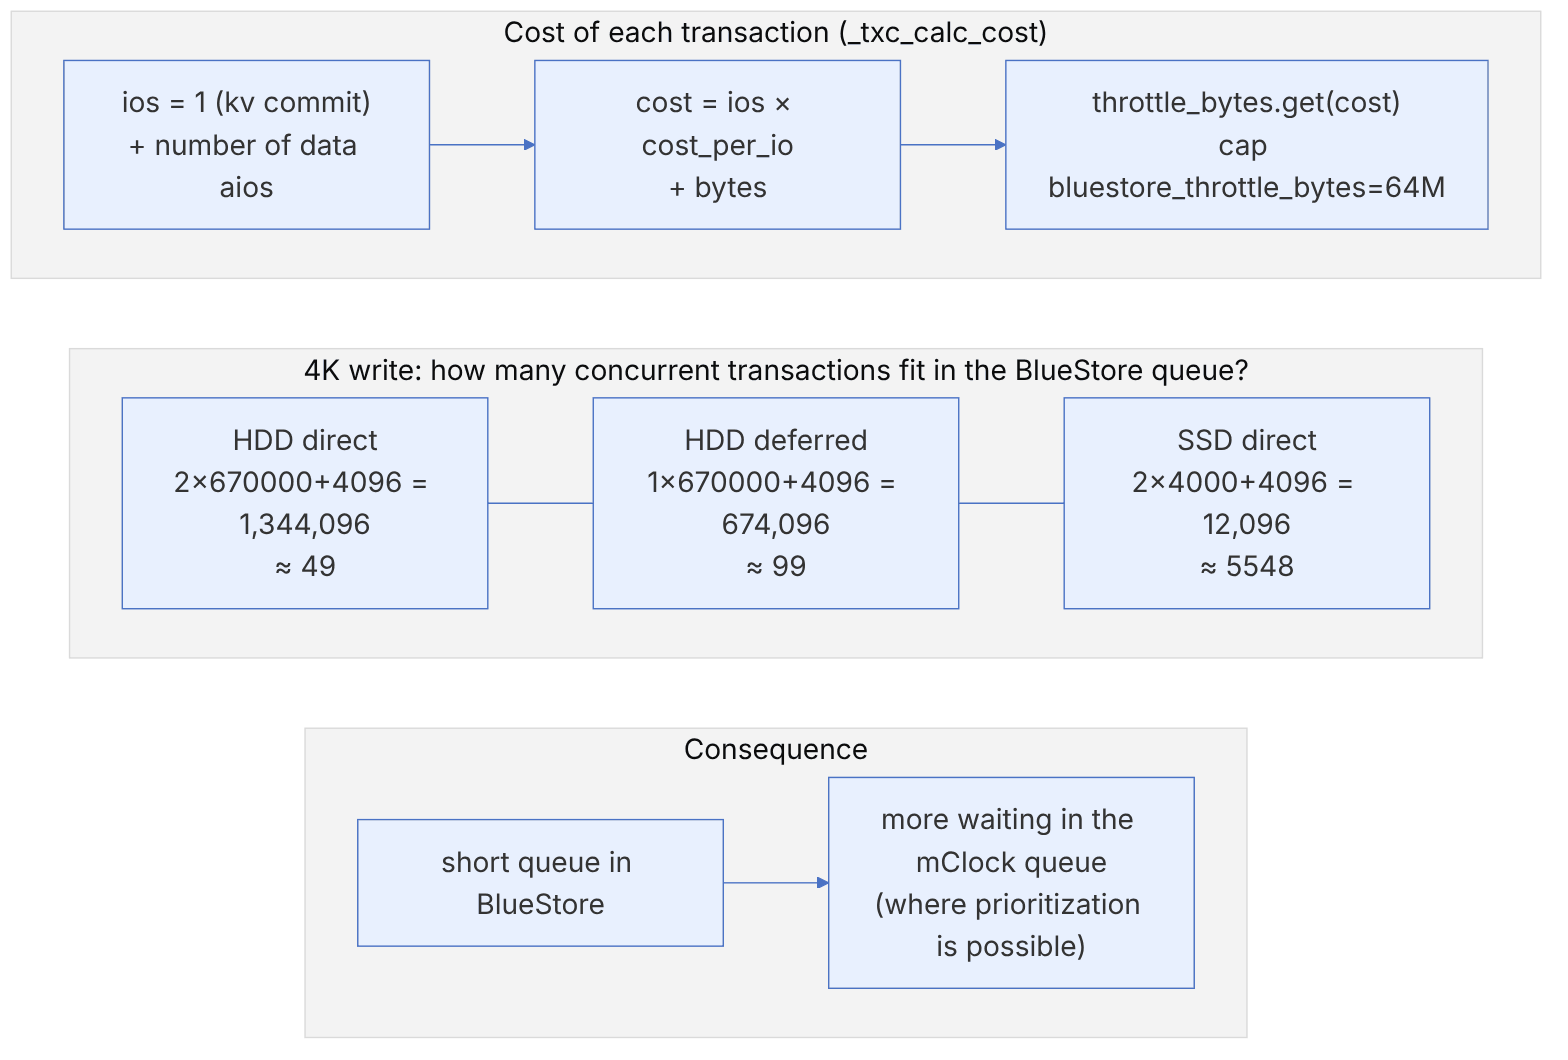
| Scenario (4K write) | ios | cost (byte equivalent) | Concurrent in 64MiB |
|---|---|---|---|
| HDD, direct write | 2 | 2×670000+4096 = 1,344,096 | ≈ 49 |
| HDD, deferred (data in WAL) | 1 | 670000+4096 = 674,096 | ≈ 99 |
| SSD, direct write | 2 | 2×4000+4096 = 12,096 | ≈ 5548 |
Why not make the throttle larger? It is tempting to multiply bluestore_throttle_bytes for more IOPS. But every request that passes the throttle is out of mClock's control. A deep queue in BlueStore means a client request that arrived later must wait behind dozens of recovery requests, with nothing the scheduler can do. So a larger throttle does not necessarily improve client latency and may make it worse during recovery. The right method is to measure client latency under recovery load before and after the change. If you change the value, set it together with bluestore_throttle_deferred_bytes=128M, and set both identically for all OSDs of a class.
21-6-3 Messenger and threads#
In each daemon, ms_async_op_threads=3 event-loop (epoll) threads work for all connections. Each connection is pinned to one of them. On an NVMe OSD with hundreds of clients, these three threads can saturate before the disk does. The sign is that in top -H three threads named msgr-worker-N run near 100% CPU. ms_tcp_nodelay=true (disabling Nagle) is necessary for small messages. ms_tcp_rcvbuf=0 means the receive buffer size is left to the kernel's autotuning (net.ipv4.tcp_rmem), which is usually better than any fixed number.
ceph daemon osd.3 perf dump | jq '.prioritycache'                 # target/mapped/heap
ceph daemon osd.3 dump_mempools | jq '.mempool.total'
ceph daemon osd.3 perf dump | jq '.bluestore | {kv_flush_lat, kv_commit_lat, kv_sync_lat, state_kv_queued_lat}'
ceph config show osd.3 bluestore_throttle_cost_per_io             # 0 ⇒ the hdd/ssd value is used
top -H -p $(pgrep -f 'ceph-osd.*--id 3') -b -n1 | grep msgr-workerThe exact names of some BlueStore counters have changed between versions. Before building a dashboard, check the keys with perf schema on your own version.
21-7 Performance tuning in numbers: shards, memory, the write path and dmClock#
The earlier sections of this chapter described which parameters each OSD layer has. This section shows how four important decisions are made in numbers: which shard holds a PG's queue, how much memory cephadm gives each OSD, which writes BlueStore defers, and which request dmClock moves forward at any moment. All references are to main in November 2026. The defaults of mClock and the shards changed in Reef and Squid, so ceph config show osd.N on your own cluster is the final authority. The numbers were computed with a Python reimplementation.
21-7-1 Mapping a PG to a queue shard#
Source in code: src/osd/OSD.cc :: OSD::ShardedOpWQ::_enqueue, OSD::get_num_op_shards; src/osd/osd_types.h :: spg_t::hash_to_shard
Complexity: O(1)
pseudocode
num_shards = osd_op_num_shards  if ≠ 0  otherwise (rotational ? osd_op_num_shards_hdd = 1 : osd_op_num_shards_ssd = 8)
threads_per_shard = osd_op_num_threads_per_shard  or  (hdd: 5 , ssd: 2)
shard(item) = item.ordering_token.pgid.ps() mod num_shards      # all requests of a PG in one shard
each shard: a separate mClock queue and threads_per_shard threads
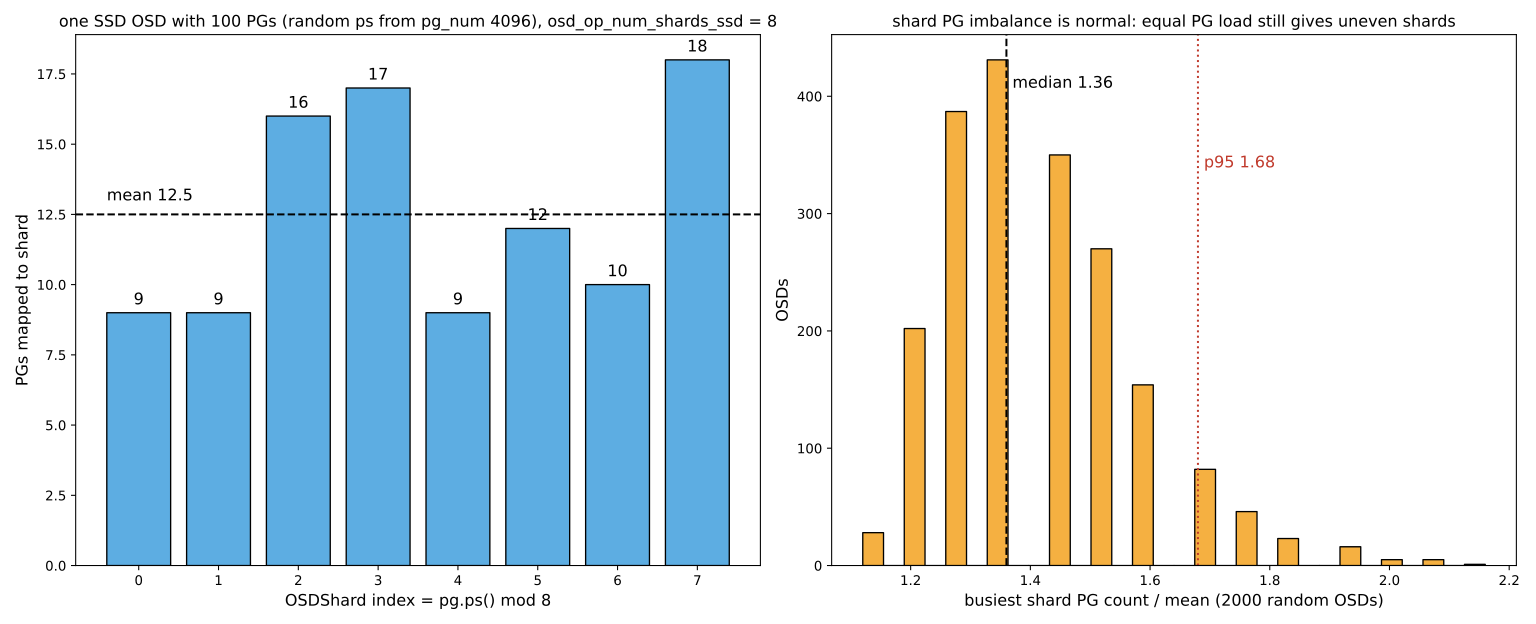
The direct consequence: a PG is never served by more than one shard. On SSD with the default 8 × 2, a very hot PG (for example a bucket's header object, or an image with heavy load on a few objects) keeps at most 2 of the 16 threads busy. The distribution of PGs among shards is not uniform either. Simulating an OSD with 100 PGs whose ps numbers were chosen at random from a pg_num of 4096 gave per-shard PG counts of 9, 9, 16, 17, 9, 12, 10 and 18. The average is 12.5, but the fullest shard has 44 percent more load than average. Across 2000 random OSDs, the ratio of the fullest shard to the average had a median of 1.36 and a 95th percentile of about 1.68. This is one of the reasons why on NVMe raising the number of PGs per OSD (and so smoothing this distribution) sometimes improves performance more than changing the number of threads. On HDD with one shard this problem does not exist: all PGs are in one mClock queue and five threads drain it.
21-7-2 Each OSD's memory share in cephadm#
Source in code: src/pybind/mgr/cephadm/autotune.py :: MemoryAutotuner.tune; src/pybind/mgr/cephadm/serve.py :: CephadmServe._autotune_host_memory
Complexity: O(D) for D daemons on the host; every autotune_interval (600 seconds)
pseudocode
total = memory_total_kb × 1024 × autotune_memory_target_ratio (0.7)
for d in the host's daemons:
    mds: total −= mds_cache_memory_limit
    OSD with osd_memory_target_autotune = false: total −= its osd_memory_target
    other OSD: add to the tuned list
    any other type: total −= max(min_size_by_type[type] or 1 GiB, current memory_usage)
        (mgr, mds and nvmeof: 4 GiB ; mon: 1 GiB ; crash, haproxy, keepalived: 128 MiB)
if total < 0 or tuned is empty: do nothing
per = ⌊total / |tuned|⌋
clear previous per-OSD settings ; config set osd/host:<host> osd_memory_target per
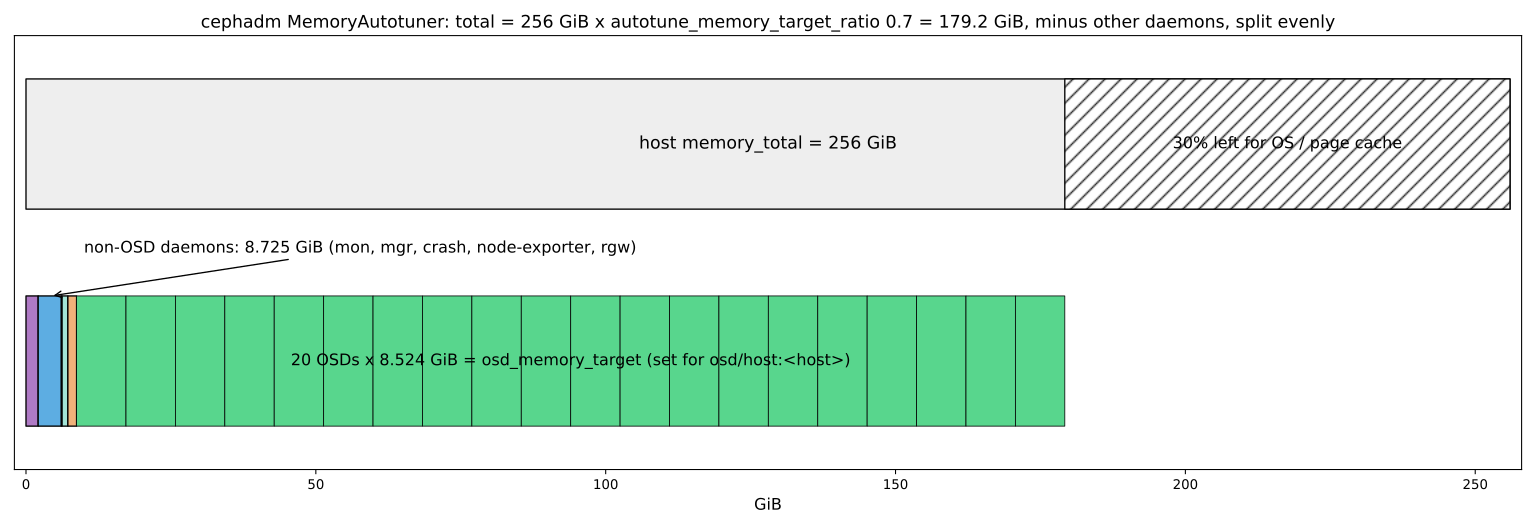
Numerical example. A host has 256 GiB of memory, one mon, one mgr, crash, node-exporter, one RGW and 20 OSDs. total = 256 × 0.7 = 179.2 GiB. Suppose the current usage of the mon is 2.1 GiB and of the RGW 1.5 GiB (example numbers). The mgr, using 3 GiB, counts as at least 4 GiB, crash as 128 MiB and node-exporter (which is not in the table) as 1 GiB. Together these are 8.725 GiB, leaving 170.475 GiB for the OSDs. Each OSD gets ⌊170.475 GiB / 20⌋ = 9152306872 bytes, about 8.52 GiB. Because the value is written with the osd/host:<host> mask, all OSDs of a host have the same number. If you exclude one OSD from this calculation with osd_memory_target_autotune = false and a manual value, its value is subtracted from the total and the rest is split among the automatic OSDs.
There are two traps. First, the daemons' current usage enters the calculation, so if the RGW suddenly uses 10 GiB, ten minutes later each OSD's share drops by about 0.4 GiB. Second, osd_memory_target is a target for mapped heap memory, not an RSS cap. The option's own description says RSS may be up to about 20 percent higher. The thirty percent the ratio sets aside is for this, for the operating system and for the page cache.
21-7-3 The BlueStore write path: small, big and deferred#
Source in code: src/os/bluestore/BlueStore.cc :: BlueStore::_do_write_data, _do_write_big, _do_alloc_write
Complexity: O(number of blobs) per write
pseudocode
# bluestore_write_v2 = false (default in main)
if offset and end−1 are in one min_alloc_size block and length ≠ min_alloc_size: _do_write_small(all)
else:
    head = [offset, p2roundup(offset, mas))      → _do_write_small
    tail = [p2align(end, mas), end)               → _do_write_small
    middle = the rest                              → _do_write_big (in pieces if segment_size)
_do_write_big: if l ≤ 2 × prefer_deferred_size: try writing into existing blobs as deferred
_do_alloc_write for a new blob: if data_size < prefer_deferred_size ⇒ deferred (first in the WAL and RocksDB, later on the device)
                                 otherwise ⇒ direct write to the device, then metadata commit
prefer_deferred_size = bluestore_prefer_deferred_size or hdd: 64K , ssd: 0
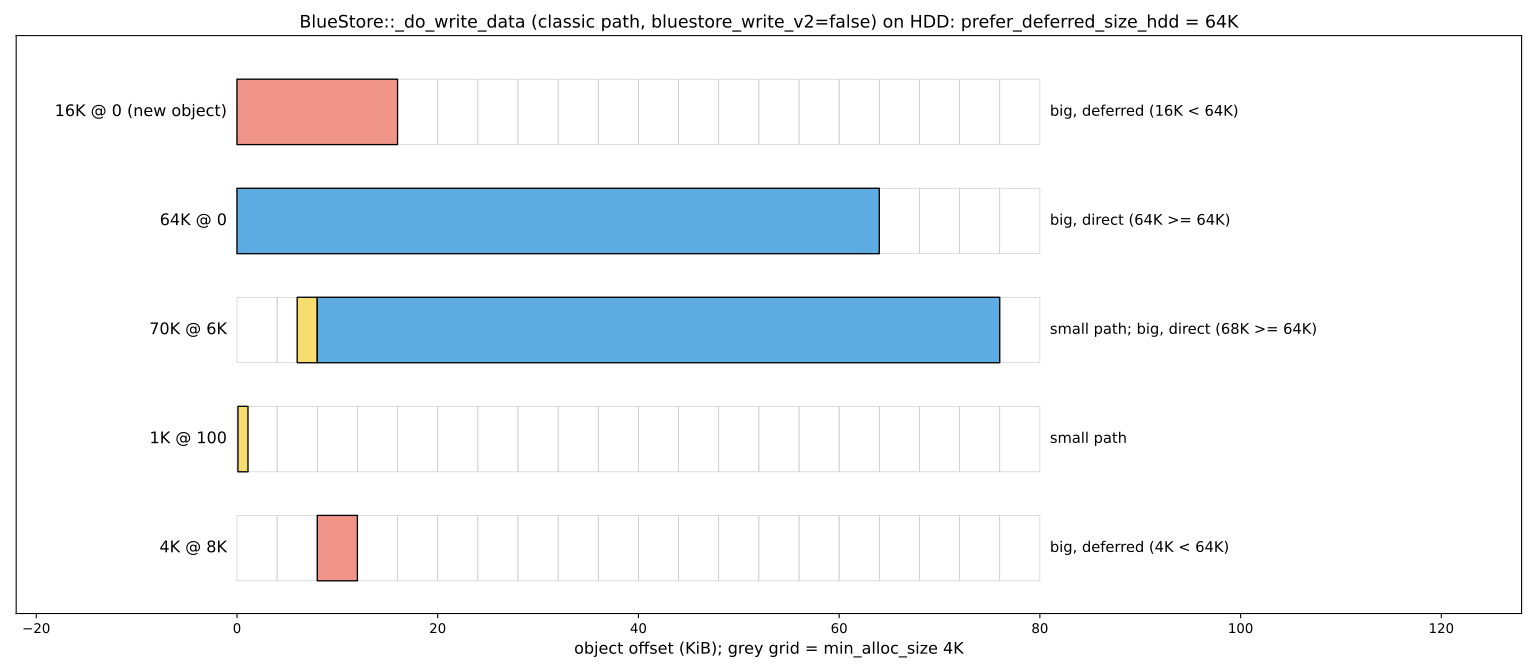
Numerical example. The OSD is on HDD, with a min_alloc_size of 4 KiB (main's default for hdd and ssd) and a prefer_deferred_size of 64 KiB.
- 16 KiB at offset zero of a new object: offset and end − 1 are in blocks 0 and 3, so head and tail are zero and the whole 16 KiB goes to the big path. The blob is new and 16 KiB < 64 KiB, so it is written deferred: the data first lands in a RocksDB transaction (on the DB/WAL device if separate) and is later applied to the HDD.
- 64 KiB at offset zero: 64 KiB < 64 KiB does not hold, so it is written directly to the HDD and only the metadata goes to RocksDB.
- 70 KiB at offset 6 KiB: the 2 KiB head (6 to 8 KiB) goes to the small path, and the 68 KiB middle (8 to 76 KiB) goes to big and is written directly. Because end = 76 KiB is aligned, the tail is zero.
- 1 KiB at offset 100: it is inside one block and goes to the small path.
- Aligned 4 KiB at offset 8 KiB: it is inside one block, but because length = min_alloc_size it goes to the else branch and the big path, and is deferred.
On SSD with a prefer_deferred_size of 0, the condition data_size < 0 never holds and no big write is deferred. An HDD cannot perform small random writes quickly, so BlueStore first writes them sequentially to the WAL and applies them later in the background. The cost is writing twice. If DB/WAL is on NVMe, these two writes in practice bring small-write latency close to NVMe latency. The small path has its own separate logic (read-modify-write and deferred on an existing blob), covered in chapters 12 and 24. A new bluestore_write_v2 path exists in main, but its default is false and these examples do not cover it.
21-7-4 dmClock in numbers#
Source in code: src/dmclock/src/dmclock_server.h :: RequestTag::RequestTag, tag_calc, PriorityQueueBase::do_next_request, reduce_reservation_tags; src/osd/scheduler/mClockScheduler.h
Complexity: O(log C) for C clients (three heaps)
pseudocode
tag_calc(t, prev, inv, extreme_high): inv == 0 ? (high ? max_tag : min_tag) : max(t, prev + inv × cost)
on arrival or reaching the head of the queue (IsDelayed = true in the OSD):
    R = tag_calc(t, R_prev, 1/res, high) ; P = tag_calc(t, P_prev, 1/wgt, high) ; L = tag_calc(t, L_prev, 1/lim, low)
do_next_request(now):
    if minimum R ≤ now: serve from the reservation phase
    else: mark every head with L ≤ now ready ; if a ready one with minimum P exists: serve from the weight phase
          and reduce the R of that client's queue head by 1/res × cost      # so weight service does not count toward the reservation
    else (AtLimit::Wait in the OSD): wait until the next minimum R or L
In the OSD, each request's cost is max(size in bytes, osd_bandwidth_cost_per_io), and reservations and limits are expressed in bytes per second (chapter 10). To make the logic clear, in this example we took each request's cost as 1 and the units as requests per second.
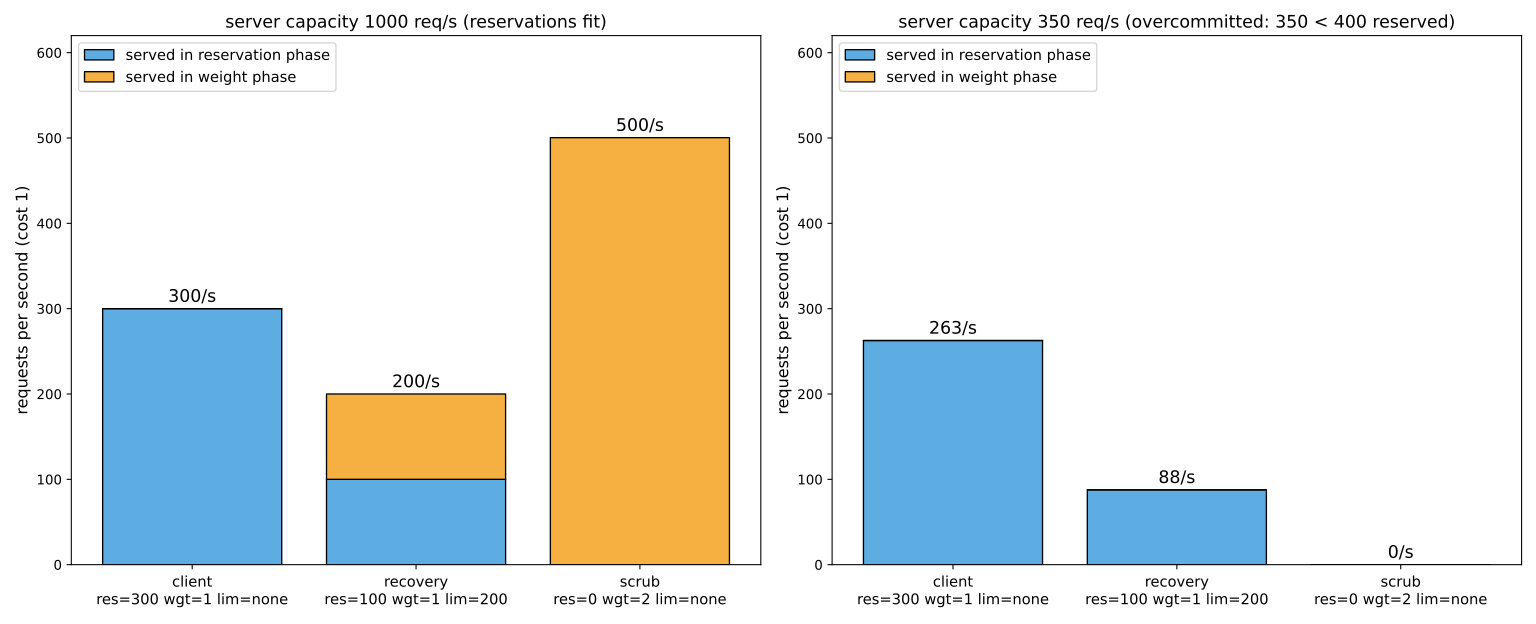
Numerical example. Three clients send requests continuously: client with res = 300, wgt = 1 and no limit; recovery with res = 100, wgt = 1 and lim = 200; scrub with res = 0 and wgt = 2. Our simulation ran this same algorithm with 1-millisecond steps.
- Capacity of 1000 requests per second: client got 300 requests per second, all in the reservation phase. recovery got 200: 100 from reservation and 100 from weight, and its limit of 200 stopped it. scrub got the rest, 500, in the weight phase. Why did client get no share from the weight phase? Each client's P tag advances with every served request, even in the reservation phase. client's 300 requests advanced its P tag by 300 seconds, while scrub, with weight 2, advances only 0.5 per request. client's weighted share of the 800 requests left for client and scrub is 800 / 3 ≈ 267, which is less than its reservation of 300. So client gets just the 300. This is exactly mClock's expected behaviour: each client gets roughly max(reservation, weighted share).
- Capacity of 350 requests per second (less than the 400 reserved requests): client got about 263 and recovery about 88, roughly the 3 to 1 ratio of the reservations. scrub got almost nothing. If the OSD's real capacity is below the sum of the reservations, the reservations shrink proportionally and clients without a reservation starve. This is why
osd_mclock_max_capacity_iops_*, if overestimated (chapter 10), makes the profile's guarantees meaningless.
21-8 Operating system, network and CPU#
| Area | Suggested setting | Why |
|---|---|---|
| CPU | tuned-adm profile throughput-performance or latency-performance; disable deep C-states in the BIOS for NVMe | cores waking from a deep C-state add tens of microseconds of latency |
| I/O scheduler | none for NVMe, mq-deadline for HDD | an extra scheduler is overhead for NVMe |
| Network | a separate cluster network or enough bandwidth; the same MTU along the whole path | recovery and replication go over the cluster network |
| MTU | if jumbo frames (9000) are used, on all switches and hosts | mismatched MTU causes packet loss and heartbeat failure |
| NUMA | keep the OSD near the network card and NVMe of the same NUMA node | less traffic between sockets |
| swap | minimal or disabled; monitor OOM | an OSD being swapped makes latency unpredictable |
# quick check on each host
cat /sys/block/nvme0n1/queue/scheduler
tuned-adm active
ip -d link show bond0 | grep -E "mtu|bond"
ping -M do -s 8972 -c 3 10.20.0.12          # test the jumbo frame path
ethtool -S ens1f0 | grep -iE "drop|err" | grep -v ": 0"The ceph-mixin alerts named CephNodeInconsistentMTU and CephNodeNetworkPacketDrops are exactly for these problems. If OSDs report "wrongly marked me down" and all hosts look healthy, check the MTU and network card errors first.
21-9 Pool and client design#
- Replicated vs EC: for small random writes (a database on RBD), replication has lower latency; EC is for large, sequential data. In Tentacle, FastEC has narrowed the gap for mixed workloads (chapter 13).
- Number of PGs: few PGs means little parallelism on fast OSDs; guide the autoscaler with
bulkandtarget_size_ratio(chapter 19). - RBD: the librbd cache for virtual machines,
rbd_cache_policyand, if needed, the persistent write-back cache; object size (default 4 megabytes) and striping for sequential workloads. - RGW: bucket index shards (dynamic resharding is enabled by default), the number of frontend threads, and putting the index pool on NVMe.
- CephFS: pinning subtrees to MDS ranks and several active MDSs for heavy metadata load.
21-10 Benchmarking#
21-10-1 Tools#
| Tool | Layer | Example |
|---|---|---|
| rados bench | RADOS (without librbd) | rados bench -p bench 60 write -b 4M -t 16 --no-cleanup |
| ceph tell osd.N bench | a single OSD | ceph tell osd.3 bench 1073741824 4194304 |
| rbd bench | librbd | rbd bench --io-type write --io-size 4K --io-pattern rand vm-fast/test |
| fio with ioengine=rbd | librbd from the application's view | a job file with ioengine=rbd |
| fio on krbd or a VM | the user's full path | fio --rw=randwrite --bs=4k --iodepth=32 --direct=1 |
| CBT | automated, repeatable benchmarking | github.com/ceph/cbt |
; fio-rbd.job — this book's example
[global]
ioengine=rbd
clientname=bench
pool=vm-fast
rbdname=fio-test
direct=1
time_based=1
runtime=300
ramp_time=30
group_reporting=1

[randwrite-4k]
rw=randwrite
bs=4k
iodepth=32
numjobs=4Always report percentiles (p99, p99.9), not just the average. Ceph may look good on average while the tail of the latency distribution (for example because of deep scrub or a slow OSD) ruins the user experience. Run benchmarks for at least several minutes with a ramp-up so the caches and BlueStore reach a steady state.
Benchmarking on a production cluster disrupts real user load, and rados bench with --no-cleanup leaves data behind. Run it in a separate pool and afterwards run rados -p bench cleanup. ceph tell osd.N bench writes to the OSD's own disk.
- One change at a time; record every change with
ceph config, reversibly. - Check CPU, disk and network before software tuning.
- Change the mClock profile by time of day, not osd_max_backfills.
- Set
osd_mclock_max_capacity_iops_*after a real benchmark, if the automatic benchmark is wrong. - Measure and report percentiles.
21-11 Supplementary and up to date#
- WPQ is no longer the default; since Quincy, mClock is the default scheduler, and most old tuning guides (recovery sleeps, osd_max_backfills) do not work with it.
- The default HDD shards changed from 5×1 to 1×5 in Squid point release 19.2.1 (issue 66289); Tentacle and Umbrella keep it.
- The starvation-prevention mechanism for mClock's immediate queue (tracker 69078) appears in the latest documentation.
- FileStore is not supported in Reef; all settings in this chapter are for BlueStore.
- Crimson/SeaStore: a rewrite of the OSD based on Seastar is under development; check its support status for your version in the documentation, and do not use it in production without being sure of official support.
21-12 Hands-on exercise#
- 1. Take a baseline with
rados benchandrbd benchand record the results with percentiles. - 2. Switch the mClock profile between balanced and high_client_ops and compare client latency during the backfill of one OSD.
- 3. Change
osd_max_backfillswithout override and see that it has no effect; then test with override and revert. - 4. See the
osd_mclock_max_capacity_iops_ssdvalue set for each OSD withceph config dumpand compare it withceph tell osd.N bench. - 5. Mismatch the MTU on one host (in a lab) and see the effect on heartbeats and alerts.
- 6. In
dmclock_server.h, find the function that chooses the next request and compare it with this chapter's pseudocode.
21-13 Review questions#
- 1. Why should performance tuning be done with a baseline and one change at a time?
- 2. How is each PG's shard determined, and why are all operations of a PG in one shard?
- 3. What change did Squid 19.2.1 make to the default HDD shards, and why is it sensible?
- 4. Define the three mClock parameters.
- 5. How is the R tag computed in dmclock, and what role does max(now, ...) play?
- 6. How does the high_client_ops profile differ from balanced?
- 7. Why does changing osd_max_backfills have no effect in the built-in profiles?
- 8. How does the OSD determine its IOPS capacity, and when does it discard the result?
- 9. Name three operating system or network settings with the greatest effect.
- 10. Why should percentiles be reported instead of the average?
Answers to these questions are in Appendix E: Answers to Review Questions. Answers to this chapter's questions →
21-14 Sources for this chapter#
- mClock config reference
https://docs.ceph.com/en/latest/rados/configuration/mclock-config-ref/ - OSD config reference
https://docs.ceph.com/en/latest/rados/configuration/osd-config-ref/ - BlueStore config reference
https://docs.ceph.com/en/latest/rados/configuration/bluestore-config-ref/ - cephadm OSD service (memory autotune
https://docs.ceph.com/en/latest/cephadm/services/osd/ - Hardware recommendations
https://docs.ceph.com/en/latest/start/hardware-recommendations/ - Network config reference
https://docs.ceph.com/en/latest/rados/configuration/network-config-ref/ - CBT (Ceph Benchmarking Tool
https://github.com/ceph/cbt - Source: src/dmclock
https://github.com/ceph/ceph/tree/main/src/dmclock - Source: src/osd/scheduler/mClockScheduler.cc
https://github.com/ceph/ceph/blob/main/src/osd/scheduler/mClockScheduler.cc - Source: src/common/options/osd.yaml.in
https://github.com/ceph/ceph/blob/main/src/common/options/osd.yaml.in - Gulati, Merchant, Varman, "mClock: Handling Throughput Variability for Hypervisor IO Scheduling" (OSDI 2010
https://www.usenix.org/conference/osdi10/mclock-handling-throughput-variability-hypervisor-io-scheduling - tracker 69078
https://tracker.ceph.com/issues/69078