Troubleshooting Ceph: From HEALTH_WARN to the Peering State Machine
TL;DR this chapter in a few lines
- Record the state first (
ceph -s,ceph health detail,ceph osd tree,ceph pg dump_stuck), then work from MONs to OSDs to PGs. - Without quorum MONs do nothing; flags such as
nooutandnodownare temporary tools to unset afterwards. ceph pg <pgid> queryshows a PG's path through the peering state machine and what it is blocked on.- Slow ops are traced with
dump_ops_in_flightanddump_historic_ops; useceph-objectstore-tooland unfound-object commands only with care, after a backup.
17-1 Before you start#
17-1-1 What questions does this chapter answer?#
Troubleshooting Ceph in the middle of an incident needs method more than memory: where to start, which command shows which layer, and when to hold back. This chapter presents a systematic method and then goes into the code to see exactly where in the PG state machine states such as down, incomplete or peering come from.
- What is the step-by-step troubleshooting method, from
ceph -sto the root of the problem? - How do we separate MON, OSD and network problems?
- What do the PG states mean, and how does the Peering state machine work?
- How do we follow slow ops down to the exact event in the operation's path?
- How does scrub find inconsistencies, and when is repair safe?
- Which commands are dangerous and used only as a last resort?
17-2 The troubleshooting method#
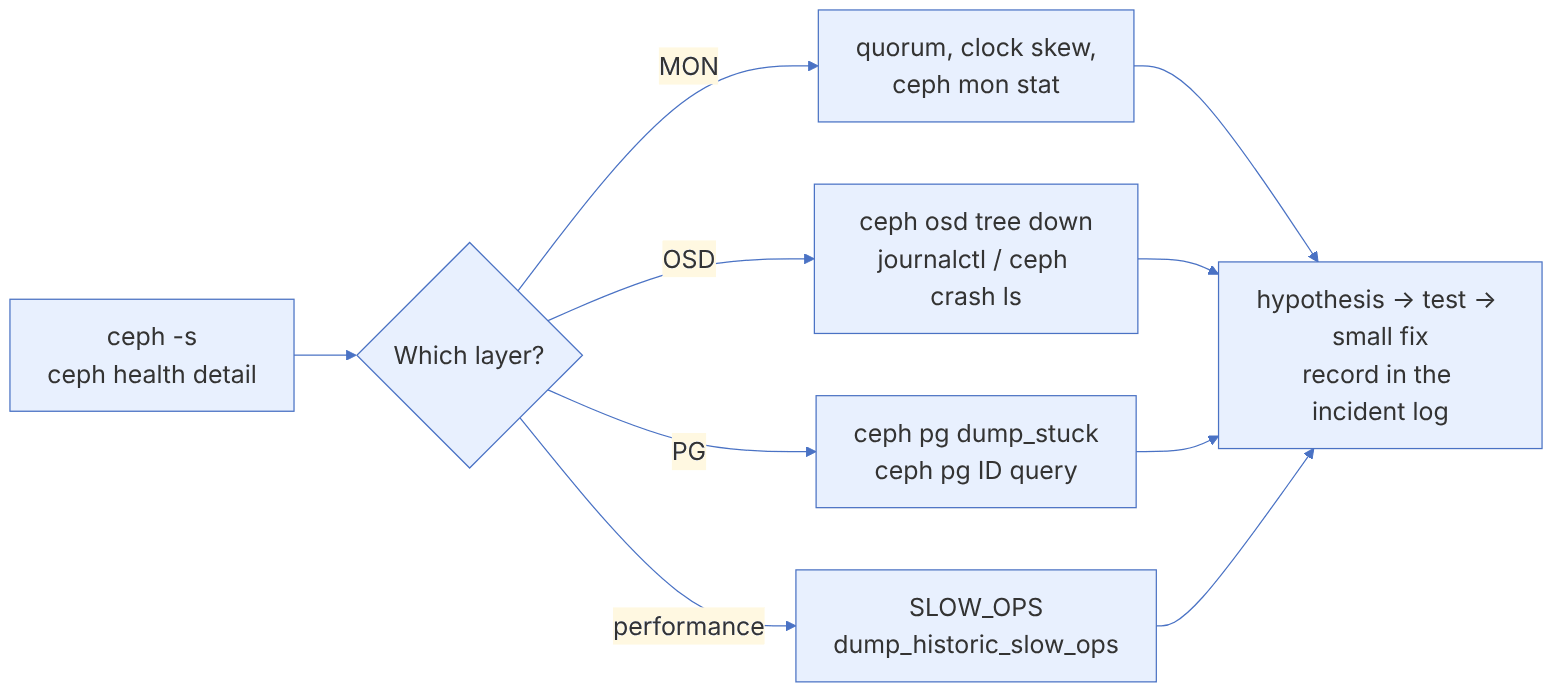
ceph -s                           # overview: health, mon, osd, pgs, io
ceph health detail                # each warning's code with details
ceph health detail --format json-pretty | jq '.checks | keys'
ceph versions                     # version mismatch after an unfinished upgrade
ceph crash ls-new                 # new crashes (RECENT_CRASH)
ceph log last 100 # the cluster log in the MONBefore any action, record the state: save the output of ceph -s, ceph health detail, ceph osd tree and ceph pg dump_stuck in a timestamped file. In the post-incident review, this data is more valuable than anything else.
In a crisis the temptation to "do something" is strong. In most cases Ceph heals itself (recovery and backfill). Hasty intervention, such as marking many OSDs ceph osd out or restarting all OSDs, usually makes things worse. The rule: one change at a time, and observe its effect.
17-2-1 Common warnings#
| Health code | Short meaning | First command |
|---|---|---|
| OSD_DOWN | One or more OSDs are down | ceph osd tree down |
| PG_AVAILABILITY | Some PGs are inactive and serve no I/O | ceph pg dump_stuck inactive |
| PG_DEGRADED | Fewer copies than size | ceph pg dump_stuck degraded |
| SLOW_OPS | Operations in flight longer than osd_op_complaint_time | ceph daemon osd.N dump_historic_slow_ops |
| OSD_NEARFULL / OSD_FULL | OSDs filling up | ceph osd df tree |
| OSD_SCRUB_ERRORS / PG_DAMAGED | Inconsistency found by scrub | rados list-inconsistent-obj PGID |
| OBJECT_UNFOUND | No valid copy of an object can be found | ceph pg PGID list_unfound |
| MON_CLOCK_SKEW | Clock difference between MONs | chronyc tracking |
| LARGE_OMAP_OBJECTS | An object with a very large omap | ceph log last and grep Large omap |
| BLUEFS_SPILLOVER | RocksDB has spilled over from block.db to the slow disk | ceph daemon osd.N bluefs stats |
| BLUESTORE_SLOW_OP_ALERT | Slow operations in the BlueStore layer | ceph health detail |
| RECENT_CRASH | A recent daemon crash | ceph crash info ID |
All codes in the table above are listed on the Health Checks page of the latest documentation. The "Troubleshooting runbook" appendix has a more complete list.
17-3 MON problems#
- Loss of quorum: no command responds. On each MON host, check with the admin socket:
ceph daemon mon.$(hostname -s) mon_status(in cephadm:cephadm shell --name mon.<host>and then the same command). Look at thestate,quorumandoutside_quorumfields. - Clock skew: Paxos depends on a time lease;
chronyc sourcesandchronyc trackingon all MONs. - store.db growth: during long unhealthy periods, the MON does not trim old maps.
ceph tell mon.* compact, and fix the cause of the unhealthiness.
Why does a MON without quorum do nothing? Every map change is a Paxos proposal that must be approved by a majority (src/mon/Paxos.cc). Even reads are not served from a MON without a valid lease, so that clients do not get a stale map. So with three MONs, losing two MONs means a complete halt of cluster management, although the OSDs keep serving I/O with the last map until a map change is needed.
17-4 OSD problems#
ceph osd tree down
ceph osd find 12                         # host and path
cephadm logs --name osd.12 -- -n 200     # on the host
ceph crash ls | grep osd.12
ceph daemon osd.12 status                # if it is up
ceph osd dump | grep -E "^osd.12 "| Symptom | Likely cause | Action |
|---|---|---|
| The OSD keeps going down/up (flapping) | Cluster network, heartbeat, heavy load | Check the network; ceph osd set nodown only temporarily |
| The OSD will not start, with a BlueStore error | Disk or metadata corruption | ceph-bluestore-tool fsck, check SMART |
| The OSD is killed by OOM | osd_memory_target exceeds RAM | Lower the memory target, check the caches |
| The OSD says "wrongly marked me down" | Heartbeat delay | Network, osd_heartbeat_grace (default 20 seconds) |
nodown and noout are temporary tools. nodown on a truly dead OSD makes clients wait for an OSD that will never respond. After fixing the problem, always run ceph osd unset; the OSDMAP_FLAGS warning reminds you. An OSD that is down is automatically marked out after mon_osd_down_out_interval (default 10 minutes), and backfill begins.
17-5 PG states#
| State | Meaning | Concern |
|---|---|---|
| active+clean | Healthy: all copies in sync | None |
| peering | OSDs are agreeing on the PG's history | If it lasts long |
| activating | Peering finished, being activated | Usually brief |
| degraded | Some objects have fewer copies than size | Medium |
| undersized | Fewer acting OSDs than size | Medium |
| remapped | acting differs from up (pg_temp) | Usually transient |
| backfill_wait / backfilling | Waiting for a reservation, or full copy of the PG | Transient |
| recovery_wait / recovering | Waiting for, or doing, log-based recovery | Transient |
| down | The OSDs needed for peering are unavailable | High: I/O stopped |
| incomplete | No OSD has enough history | High |
| stale | The MON has not heard from the primary for a while | High |
| inconsistent | Scrub found an inconsistency | High |
| recovery_unfound / backfill_unfound | An object without a valid copy | Critical |
ceph pg stat
ceph pg dump_stuck inactive
ceph pg dump_stuck unclean
ceph pg dump_stuck stale
ceph pg ls down
ceph pg 2.1f query | jq '.state, .recovery_state[0]'The output of ceph pg <pgid> query has a section called recovery_state that shows the PG's path through the state machine; for example Started/Primary/Peering/GetInfo or Started/Primary/Peering/Down, together with blocked and down_osds_we_would_probe. These are the same names defined in PeeringState.h.
17-6 Inside the code: the Peering state machine#
17-6-1 The hierarchical structure#
src/osd/PeeringState.h defines the PG state machine with boost::statechart. Each state is a struct that names its parent; for example struct GetInfo : boost::statechart::state<GetInfo, Peering>. So the full name of a state is a path: Started/Primary/Peering/GetInfo. Events (such as AdvMap for a new map, MNotifyRec for receiving information from another OSD, GotLog, Activate) move between states.
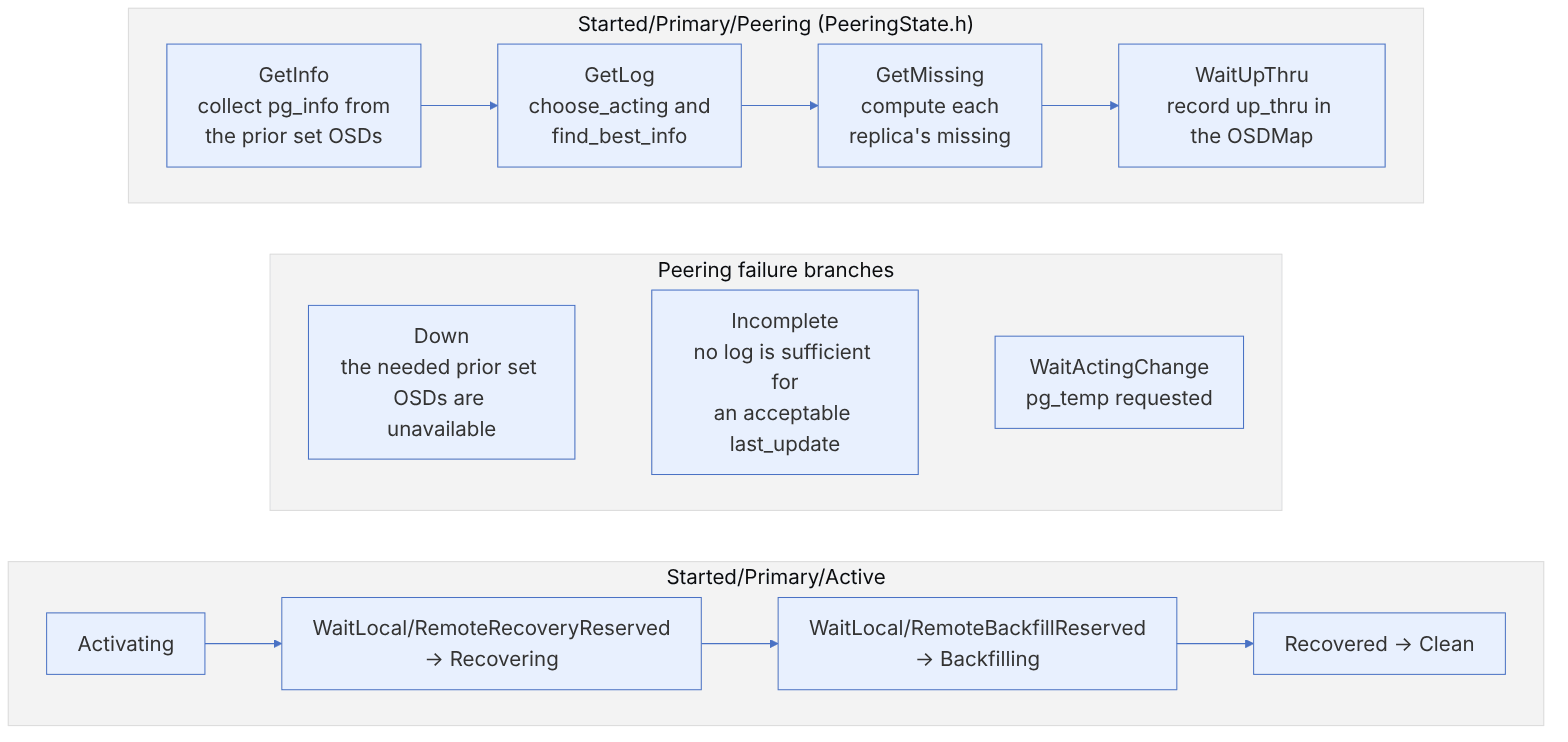
| State | Job |
|---|---|
| GetInfo | Asks all OSDs of the prior set (OSDs that may have taken writes since the last active interval) for pg_info |
| GetLog | Chooses the best log with choose_acting and fetches it from that OSD if needed |
| GetMissing | Compares each replica's log with the authoritative log and builds the missing list |
| WaitUpThru | Waits for the MON to publish this OSD's up_thru in the map |
| Down | Not enough information from the prior set; waiting for OSDs to return |
| Incomplete | Not enough log to continue; needs manual intervention |
| WaitActingChange | The primary has requested pg_temp and is waiting for a new map |
17-6-2 The prior set and up_thru: why a PG goes "down"#
The central question of peering is: could there be an acknowledged write that we do not know about? Every time the acting set changes, a new interval begins. For each past interval since the last time it became active, the PG checks whether the PG could have become active in that interval and accepted writes. This "could have" is measured with up_thru: before becoming active, the primary must wait until the MON records in the OSDMap that this OSD was alive up to this epoch (the WaitUpThru state). If there is an interval in which up_thru was recorded (so writes may have happened) and none of that interval's OSDs is available now, the PG cannot be sure and goes to Down.
pseudocode: building the prior set (this book's summary of PastIntervals in osd_types)
  for interval in past_intervals since last_epoch_started:
      if not interval.maybe_went_rw: continue        # up_thru not recorded → writes were impossible
      up_now = [osd for osd in interval.acting if osd is up]
      # replicated: if no live OSD remains from that interval → down
      if not recoverable(up_now):             pg_down = true            # EC: fewer than k shards (simplified; the real predicate is IsPGRecoverablePredicate)
      probe += up_now
return (probe, pg_down, down_osds_we_would_probe)That is why the pg query output in the down state shows the down_osds_we_would_probe field: the OSDs which, if they come back, let the PG complete peering. The right move is almost always to bring those same OSDs back, not to mark them lost. The ceph osd lost command lets the PG continue without that OSD, but any acknowledged write that existed only on that OSD is lost forever.
17-6-3 find_best_info: which log is authoritative?#
In GetLog, the function PeeringState::find_best_info() chooses the best of the received pg_infos. Its logic (this book's rewrite):
pseudocode: find_best_info(infos)
  (max_les, min_lu) = calculate_maxles_and_minlua(infos)   # the maximum last_epoch_started
  if min_lu == max: return none                              # no acceptable candidate
  best = none
  for (shard, info) in infos:
      skip if info.last_update < min_lu
      skip if info.last_epoch_started < max_les
      skip if info.is_incomplete()
      if best is none: best = info; continue
      if pool.require_rollback():          # EC: the smallest last_update is safe (rollback possible)
          prefer smaller last_update
      else:                                # replicated: the largest last_update
          prefer larger last_update
      then prefer smaller log_tail          # a longer log → log-based recovery for more replicas
      then prefer complete (no missing)
      then prefer current primary / up set
return bestThe difference between replicated and EC is instructive: in a replicated pool, the replica with the newest write becomes the reference and the others catch up with it via the log. In EC, a partial write across a few shards cannot be reconstructed; so Ceph takes as reference the version that all shards can roll back to. This is why EC needs rollback info in the log (require_rollback()).
The option osd_find_best_info_ignore_history_les (checked in PeeringState.cc) is only for emergency recovery of incomplete PGs and can throw away acknowledged data. Use it only with full understanding, on one OSD, temporarily and preferably with expert guidance, and revert it immediately.
17-7 Three troubleshooting algorithms in numbers#
A good troubleshooter should know exactly which calculation produces outputs such as "PG is down", "slow request 61 seconds old" or "deep scrub is behind". This section follows three calculations with sample data.
17-7-1 Which OSD has the authoritative log?#
Source in code: src/osd/PeeringState.cc :: PeeringState::calculate_maxles_and_minlua, PeeringState::find_best_info
Complexity: O(R) for R received infos, two linear passes
pseudocode
max_les = 0
for info: max_les = max(max_les, info.history.les)            # unless osd_find_best_info_ignore_history_les
          if !incomplete: max_les = max(max_les, info.les)
min_lua = min(info.last_update | info.les ≥ max_les)          # if none: the PG has no valid info
best = ∅
for info (only up/acting if restrict):
    skip if lu < min_lua or les < max_les or incomplete
    replicated: larger lu is better ; EC (require_rollback): smaller lu is better
    on a tie: smaller log_tail (longer log) ; then no missing ; then the current primary
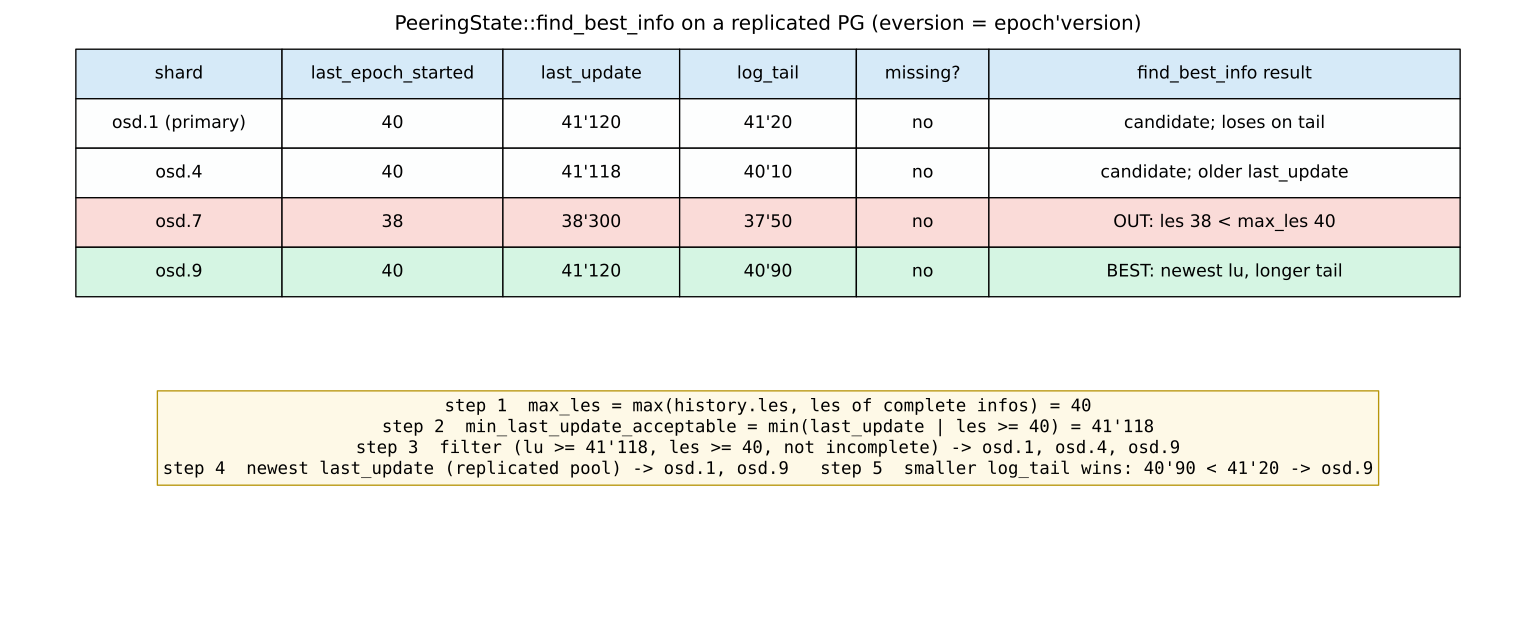
Numerical example. A replicated PG receives four infos (eversion in the form epoch'version):
| OSD | les | last_update | log_tail |
|---|---|---|---|
| osd.1 (primary) | 40 | 41'120 | 41'20 |
| osd.4 | 40 | 41'118 | 40'10 |
| osd.7 | 38 | 38'300 | 37'50 |
| osd.9 | 40 | 41'120 | 40'90 |
The selection steps:
- 1. max_les = 40.
- 2. min_lua among les ≥ 40 is 41'118. eversion comparison looks at the epoch first, so 38'300 is smaller than 41'118 even though its version is larger.
- 3. osd.7 is dropped because of its les of 38.
- 4. Of the three remaining candidates, osd.1 and osd.9 have the newest last_update.
- 5. The smaller tail, that is 40'90 < 41'20, wins, so osd.9 becomes the reference, not the primary.
After this step the primary fetches the authoritative log from osd.9 (GetLog). If all OSDs with les = 40 had failed, min_lua would remain undefined and the PG would get stuck in down/incomplete. This is exactly where ceph pg query shows the down_osds_we_would_probe list in its recovery_state section.
17-7-2 Timing of the slow request warning#
Source in code: src/common/TrackedOp.cc :: OpTracker::with_slow_ops_in_flight, OpTracker::check_ops_in_flight, visit_ops_in_flight
Complexity: O(number of in-flight ops) per check; each shard's ops are walked in order of start time, stopping at the first young op
pseudocode
too_old = now − osd_op_complaint_time (30 s)
visit ops by initiated (oldest to newest):
    if op.initiated ≥ too_old: stop                # the rest are younger
    if continuous or multiplier == 0: skip
    slow++                                         # counted in SLOW_OPS and health
    if warned ≥ osd_op_log_threshold (5): continue # count only, no log
    if op.initiated + 30 × multiplier ≥ now: continue
    warned++ ; log "slow request …" ; multiplier ×= 2
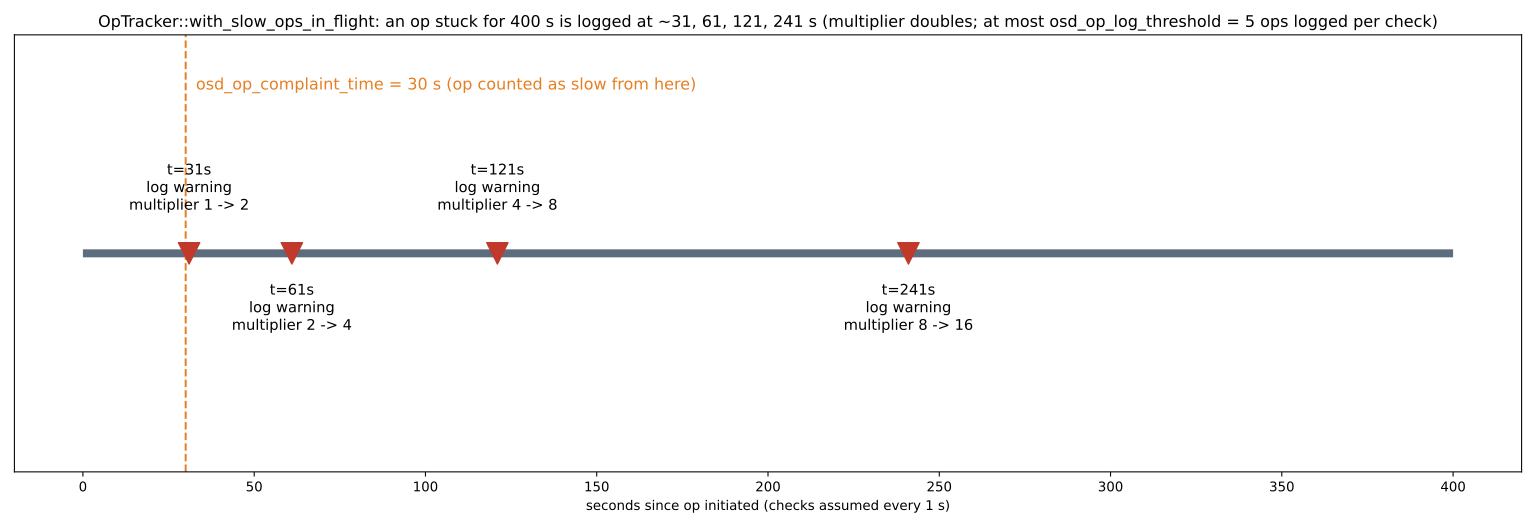
Numerical example. An op got stuck at t = 0, and the OSD checks every second.
- t = 31 s: the op is slow and multiplier = 1, so 0 + 30 < 31 and it is logged. multiplier becomes 2.
- The next log is when 0 + 60 < now, that is t = 61. After that t = 121 and t = 241 (multiplier 4 and 8).
- In total, four log lines are written for this op in 400 seconds, but it is counted in SLOW_OPS the whole time.
If 50 ops are slow at once, each check logs at most 5 lines, but "50 slow requests" is reported. So a quiet log does not mean few slow ops. To see all of them, use ceph daemon osd.N dump_ops_in_flight and dump_historic_slow_ops.
17-7-3 When is the next scrub?#
Source in code: src/osd/scrubber/scrub_job.cc :: ScrubJob::adjust_shallow_schedule, ScrubJob::adjust_deep_schedule, ScrubJob::guaranteed_offset; src/osd/scrubber/pg_scrubber.cc :: PgScrubber::populate_config_params
Complexity: O(1) per PG after each scrub
pseudocode
shallow (if not urgent): target = last + min_interval + min_interval × randomize_ratio × U[0,1]
                         not_before = max(last, target)
deep:  sdv = deep_interval × cv
       target = last + clamp(N(deep_interval, sdv), deep_interval − 2·sdv, deep_interval + 2·sdv)
urgent (operator/repair): time = scrub_must_stamp , no randomness
guaranteed_offset: shallow = min × (2 + ratio) , deep = deep + 3·sdv + 10 s
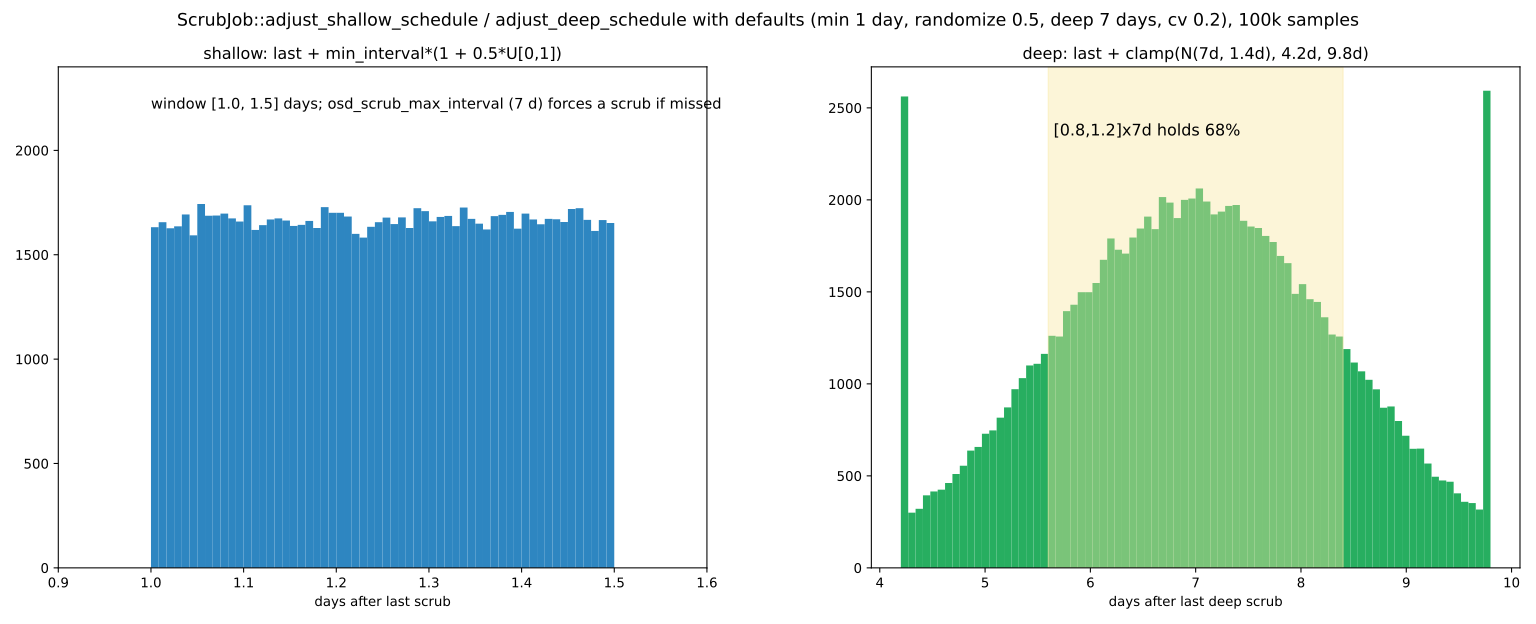
Numerical example (defaults: min 1 day, randomize 0.5, deep 7 days, cv 0.2).
- Shallow scrub: the next one is uniformly distributed between 1 and 1.5 days after the last scrub.
- Deep scrub: sdv = 1.4 days, and the sample is clipped to the range 4.2 to 9.8 days. In a simulation of 100000 samples, about 68% fell between 5.6 and 8.4 days (0.8 to 1.2 times), and about 2.3% landed exactly on the two limits.
The long_desc of the osd_deep_scrub_interval_cv option says 95% are within [0.8, 1.2]. But with cv = 0.2 this range is only one standard deviation. 95% lie within ±2σ, that is [0.6, 1.4]. This inconsistency is in the option's help text, not in the behaviour. For a cluster with 4096 PGs, this spread means about 585 deep scrubs per day on average (4096/7), without all of them starting on the same day.
Version-dependent. The osd_deep_scrub_interval_cv option and normal-distributed deep scrub scheduling exist from v19.2.x (Squid) onward (checked in v19.2.3, v20.2.0 and v21.2.0). In v18.2.4 (Reef) this option does not exist, and deep scrubs were randomized with osd_deep_scrub_randomize_ratio and a probability of upgrading a shallow scrub to deep. Before tuning, check ceph config help osd_deep_scrub_interval_cv on your own version.
17-8 Troubleshooting with measured data#
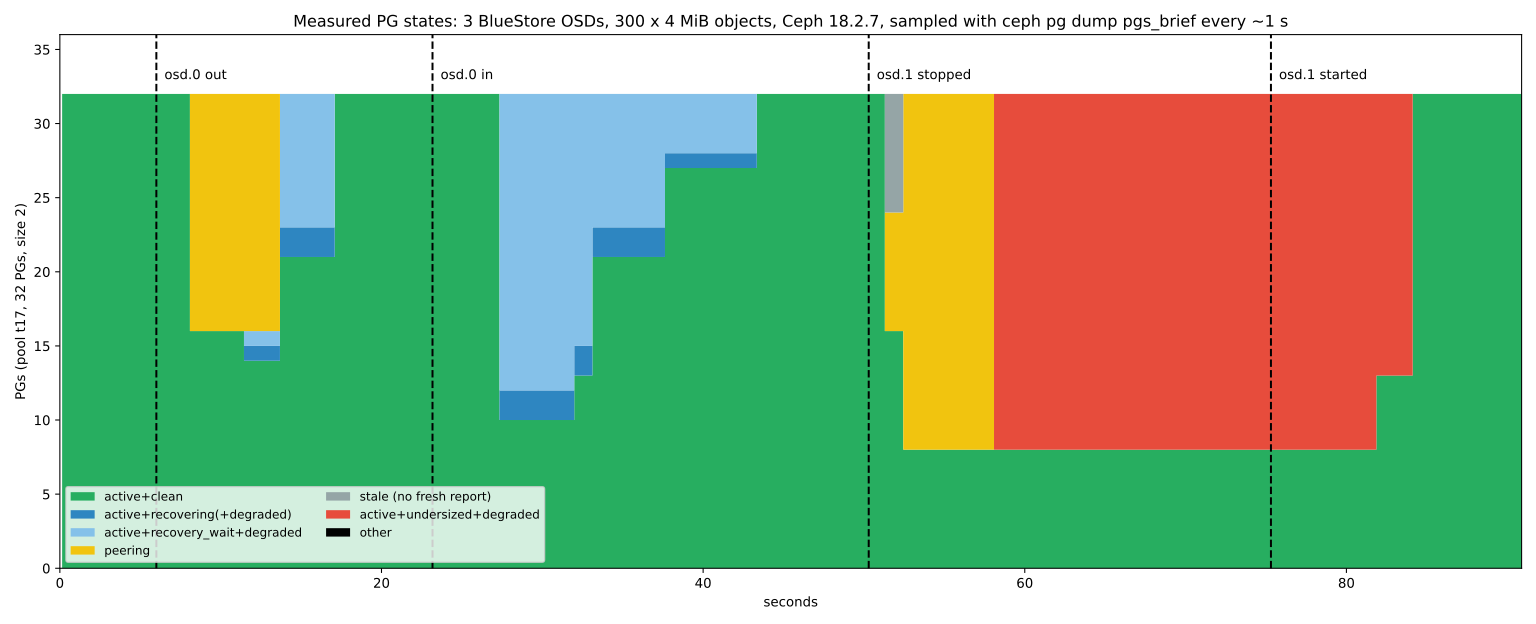
The two figures in this section are built from real data, not guesses. The first shows the timeline of PG states on a real test cluster. The second shows the effect of losing hosts with an exact count over a CRUSH mapping.
17-8-1 Timeline of PG states#
The experiment ran on a three-OSD BlueStore cluster with Ceph 18.2.7 (Debian packages). The pool t17 had 32 PGs and size = 2, and 300 objects of 4 MiB had been written into it. Every second, ceph pg dump pgs_brief -f json was taken and the states counted. Four events were run back to back: ceph osd out 0, then ceph osd in 0, then stopping the osd.1 process, and finally restarting it.
Source in code: ceph pg dump pgs_brief (PGMap in the mgr); the state string from pg_state_string in src/osd/osd_types.cc
Complexity: O(pg_num) per sample
pseudocode
every 1 second:
    pgs = ceph pg dump pgs_brief -f json
    count[state] += 1 for each pg                 # state like "active+recovery_wait+degraded"
    grouping: clean / recovering / recovery_wait / peering / stale / undersized
the next event runs only when all 32 PGs are active+clean again
What was seen.
- Marking osd.0 out: about 16 PGs went to peering. Then, instead of backfill, the PGs were seen in
recovery_wait+degradedandrecovering. The reason is that in this pool each PG has only about 9 objects, and each PG's log, which keeps at least osd_min_pg_log_entries = 250 entries, covers all the changes. So the new OSD is recovered from the log. In a real cluster with thousands of objects per PG, the same event producesbackfill_waitandbackfilling. - Marking it in again: 22 PGs stayed in
recovery_wait+degradedfor a few seconds and were queued. This is the osd_max_backfills and osd_recovery_max_active cap under mClock. - Stopping osd.1:
stalewas seen for a few seconds, because the mgr did not have a fresh report yet. Then peering took about 6 seconds, and at the end exactly 24 PGs, that is all PGs that had osd.1 in their up set, becameactive+undersized+degraded. I/O continued because min_size = 1. This setting is only for the experiment and is dangerous in a real environment. - Bringing osd.1 back up: the PGs became clean with log-based recovery within a few seconds. The pause shown is more the delay in statistics reporting than the recovery itself.
17-8-2 Losing one, two or three hosts#
Source in code: up mapping from osdmaptool --test-map-pgs-dump; the min_size criterion in PeeringState (chapter 17)
Complexity: O(C(H,k) × pg_num × size)
pseudocode
for each combination F of k hosts (all C(10, k) combinations):
    for each PG: n = number of replicas on the hosts in F
        degraded if n ≥ 1 ; inactive if size − n < min_size ; lost if n = size
mean, minimum and maximum over the combinations
P(a client touching N objects gets stuck) = 1 − (1 − p_inactive)^N      # object→PG with a uniform hash
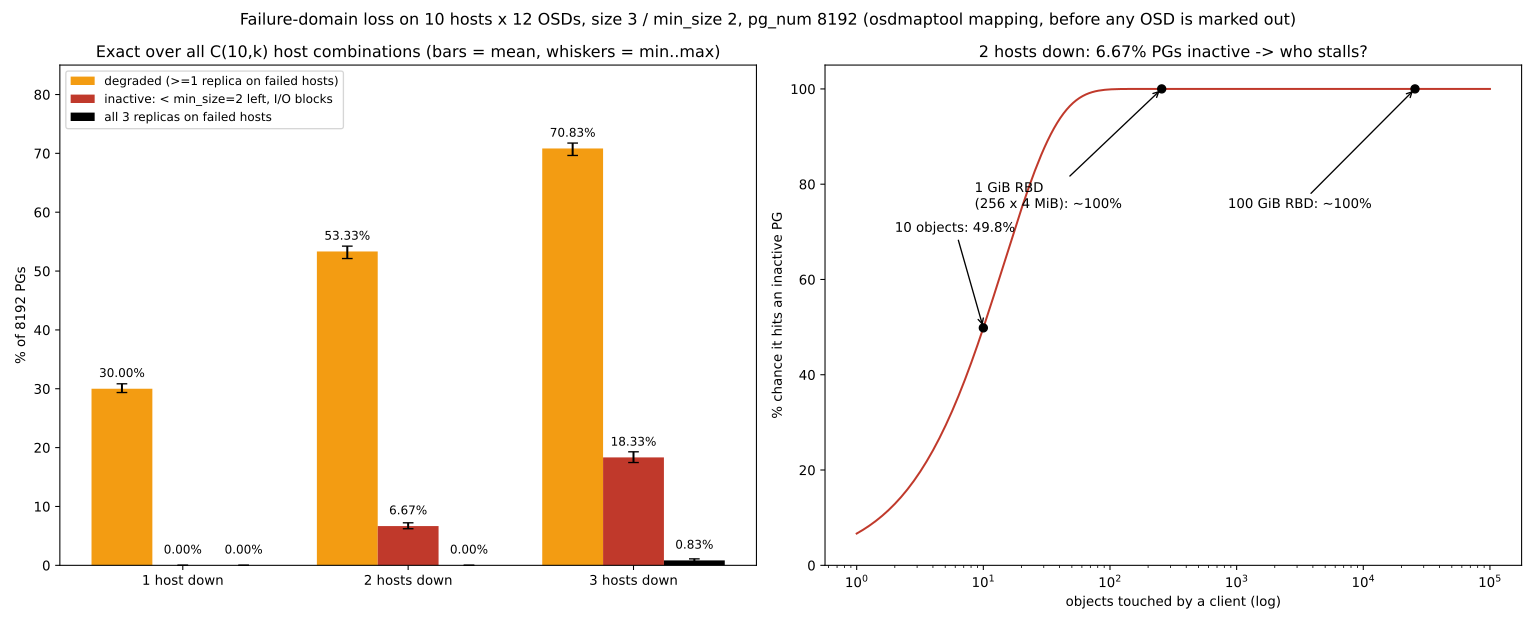
Result (120 OSDs, size = 3, min_size = 2, 8192 PGs).
| Failed hosts | Degraded PGs | Inactive PGs | PGs with no copy |
|---|---|---|---|
| 1 | 30.00% | 0 | 0 |
| 2 | 53.33% | 6.67% (546 PGs, range 509 to 592) | 0 |
| 3 | 70.83% | 18.33% | 0.83% (68 PGs) |
The means agree with closed-form formulas. For one host it is 3/10. For inactive PGs with two hosts it is C(8,1)/C(10,3) = 8/120. For PGs with no copy with three hosts it is 1/C(10,3) = 1/120.
The practical message is in the inactive column. With two failed hosts only 6.67% of PGs stop I/O. But a one-gigabyte RBD image (256 objects) has at least one object on them with probability . Even a client that touches only 10 objects gets stuck in 50% of cases. So "only 7% of PGs" in practice means almost every virtual machine has stopped.
Until the OSDs are marked out (mon_osd_down_out_interval, chapter 7), CRUSH does not choose new locations and this state continues. If two failure domains are at risk at the same time, the remedy is raising size or choosing a larger failure domain, not lowering min_size.
17-9 slow ops: following an operation#
17-9-1 TrackedOp and events#
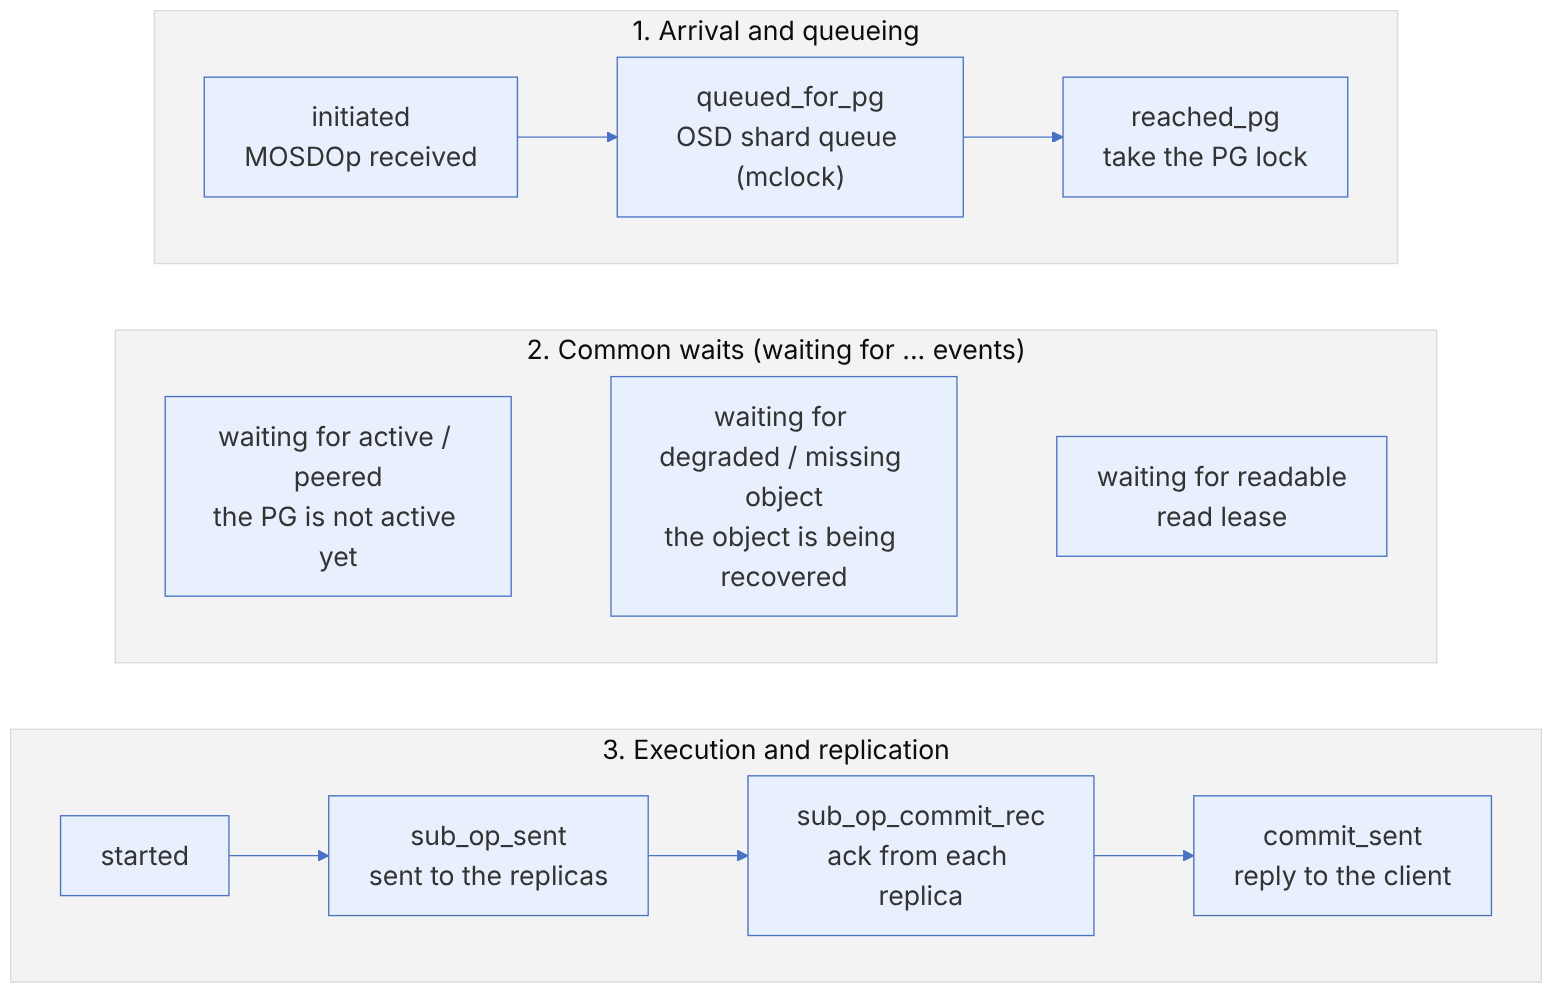
Each client request in the OSD is an OpRequest (a subclass of TrackedOp) that records "events" along its path. If an operation takes longer than osd_op_complaint_time (default 30 seconds), it is counted in the SLOW_OPS warning.
ceph health detail | grep -A3 SLOW_OPS
ceph daemon osd.7 dump_ops_in_flight | jq '.ops[] | {age, description, last: .type_data.events[-1].event}'
ceph daemon osd.7 dump_blocked_ops
ceph daemon osd.7 dump_historic_slow_ops | jq '.ops[0].type_data.events'
ceph daemon osd.7 dump_historic_ops_by_duration | jq '.ops[0:3][] | {duration, description}'| Last event | Interpretation | Where to look next |
|---|---|---|
| queued_for_pg | Stuck in the shard queue; the OSD or PG is overloaded | mclock, CPU, ceph osd perf |
| reached_pg and waiting for peered/active | The PG is not active | ceph pg PGID query |
| waiting for degraded/missing object | The object is being recovered | Recovery priority, ceph pg force-recovery |
| sub_op_sent without sub_op_commit_rec | A replica is slow | The same operation on the replica OSD, its disk or network |
| op_commit or BlueStore latency | The local disk is slow | ceph osd perf, iostat, BLUESTORE_SLOW_OP_ALERT |
The basic event names (queued_for_pg, reached_pg, started, commit_sent) are recorded in src/osd/OpRequest.h, and the "waiting for ..." events in various places in PrimaryLogPG.cc and OSD.cc. Because these strings are not part of a stable interface, do not rely on them hard in automated tools.
A slow op on the primary is often a symptom, not the cause. If the last event is sub_op_sent, look for the same request id on the replica OSDs; usually one slow disk or one broken network link is behind dozens of slow ops on different OSDs. ceph osd perf (the commit_latency and apply_latency columns) is the quickest way to find the slow OSD.
17-10 Scrub and inconsistency#
17-10-1 The scrub state machine#
Periodic scrub (default osd_scrub_min_interval=1_day) compares object metadata between copies, and deep scrub (osd_deep_scrub_interval=7_day) also reads the data and verifies checksums. The new scrub code is in src/osd/scrubber/, and its state machine is defined in scrub_machine.h with boost::statechart.
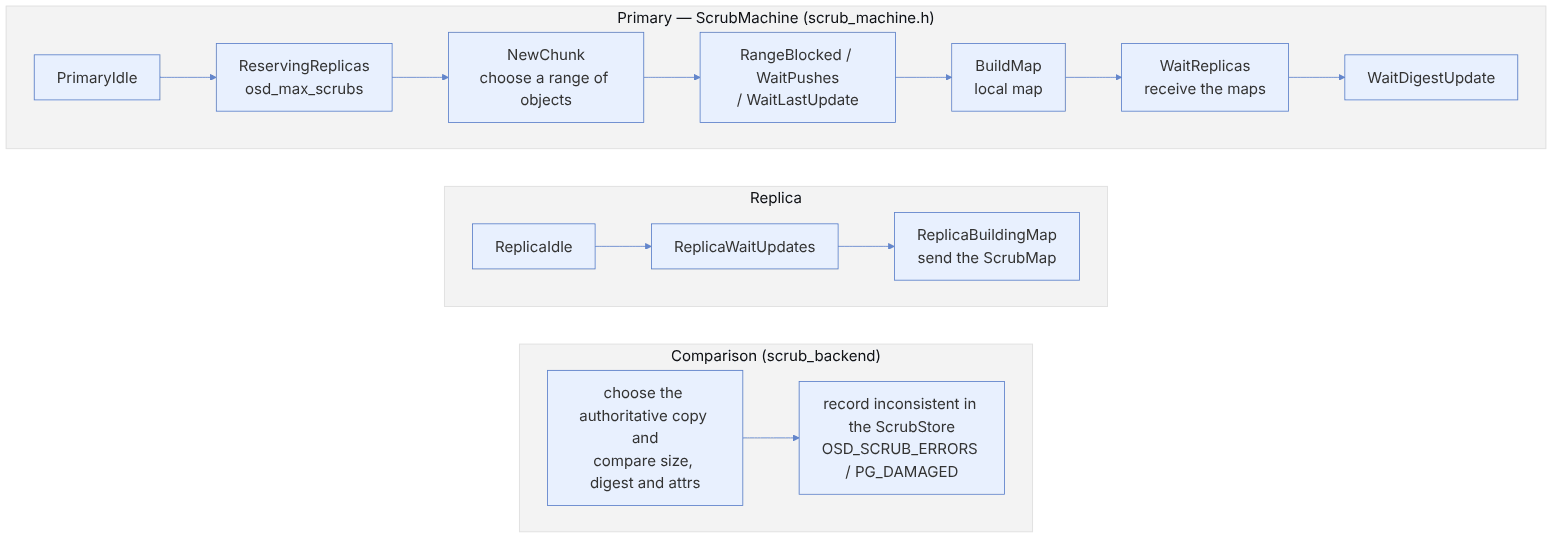
Scrub proceeds by chunk: the primary chooses a range of objects (NewChunk), waits if writes to that range are in flight (RangeBlocked, WaitPushes, WaitLastUpdate), then builds a local map (ScrubMap) and also asks the replicas for maps. scrub_backend compares the maps: size, xattrs, data digest and omap. Inconsistencies are recorded in the ScrubStore (a temporary object) and can be read with rados list-inconsistent-obj.
ceph health detail | grep -E "inconsistent|scrub errors"
rados list-inconsistent-pg rbd
rados list-inconsistent-obj 2.1f --format=json-pretty | jq '.inconsistents[] | {object: .object.name, errors, shards: [.shards[] | {osd, errors}]}'
ceph pg deep-scrub 2.1f          # confirm again before repairing
ceph pg repair 2.1fBefore ceph pg repair, read the output of list-inconsistent-obj. If the error is on one shard or one OSD (for example read_error or data_digest_mismatch only on osd.12), repair replaces it with the healthy copy, and you should check osd.12's disk (SMART and dmesg). If several copies disagree with each other and the authoritative copy is unclear, repair may choose the wrong copy. A rising OSD_TOO_MANY_REPAIRS counter is a sign of gradual disk failure.
17-11 Unfound objects and dangerous tools#
ceph pg 2.5 list_unfound
ceph pg 2.5 query | jq '.recovery_state[] | select(.name|test("Active")) | .might_have_unfound'
# last resort, after making sure the OSD holding a copy will not come back:
ceph pg 2.5 mark_unfound_lost revert # or delete| Tool | Use | Risk |
|---|---|---|
| ceph osd lost N | Allow peering without a dead OSD | Loss of acknowledged writes that existed only on that OSD |
| mark_unfound_lost revert/delete | End the wait for an unfound object | Reverting to a previous version or deleting the object |
| ceph-objectstore-tool | Read, export and import PGs from a stopped OSD | Direct modification of OSD data; only with the OSD stopped |
| ceph-bluestore-tool fsck/repair | Check and repair BlueStore metadata | repair may modify metadata |
| osd_find_best_info_ignore_history_les | Recovering an incomplete PG | Discarding acknowledged data |
To rescue a PG from an OSD that no longer starts but whose disk is readable: stop the OSD, list the PGs with ceph-objectstore-tool --data-path /var/lib/ceph/osd/ceph-12 --op list-pgs, export with --op export --pgid 2.5 --file /backup/2.5.export, and import on a healthy (stopped) OSD with --op import. In cephadm, do this inside cephadm shell --name osd.12. Chapter 18 describes this procedure more fully.
- Always start from
ceph health detailand the warning code. - Record the state before changing anything; one change at a time.
recovery_stateinpg queryshows the exact PeeringState state name.- A down PG means "bring back the OSDs in this list", not "mark them lost".
- Follow a slow op to its last event and on to the replica OSD.
- Before repairing, read the inconsistency and find the guilty disk.
17-12 Supplementary and up to date#
- Since Pacific, the scrub code has been rewritten and moved to
src/osd/scrubber/with its own state machine; its scheduling is integrated with mclock. - Newer warnings such as
BLUESTORE_SLOW_OP_ALERTandDB_DEVICE_STALLED_READ_ALERTappear in the Health Checks documentation and reveal storage-layer slowness earlier. - In the main branch, new states such as
MigratingSource,MigratingTargetandWaitLocalPoolMigrationReservedhave been added to PeeringState for pool migration; these states do not exist in the v20.2.0 and v21.2.0 tags and belong to future releases. ceph crash(an mgr module) has replaced searching for core dumps by hand.
17-13 Hands-on exercise#
- 1. In a test cluster with size=3, stop two of a PG's three OSDs and follow
recovery_stateinpg query. - 2. With
ceph osd set noout, shut down a host for maintenance; record the PG states and compare after it returns. - 3. With
tc qdisc add dev eth1 root netem delay 200mson one host, create slow ops and trace them to the guilty OSD. - 4. Corrupt an object directly on one OSD (with ceph-objectstore-tool), run a deep scrub and analyse the output of list-inconsistent-obj.
- 5. Read the state machine in
PeeringState.hand write down the path fromResettoCleanfor a healthy PG. - 6. Export a PG with ceph-objectstore-tool and import it on another OSD.
17-14 Review questions#
- 1. What are the first two commands in any incident, and why?
- 2. What is the difference between degraded, undersized and remapped?
- 3. What problem does the WaitUpThru state solve?
- 4. Why does a PG go down, and what does the down_osds_we_would_probe field say?
- 5. How does find_best_info differ between replicated and EC pools, and why?
- 6. What does a last event of sub_op_sent in a slow op mean?
- 7. How does scrub coordinate with in-flight writes?
- 8. What should you check before ceph pg repair?
- 9. What is the risk of ceph osd lost?
- 10. Why must nodown and noout be temporary?
Answers to these questions are in Appendix E: Answers to Review Questions. Answers to this chapter's questions →
17-15 Sources for this chapter#
- Health checks
https://docs.ceph.com/en/latest/rados/operations/health-checks/ - Monitoring OSDs and PGs
https://docs.ceph.com/en/latest/rados/operations/monitoring-osd-pg/ - Placement group states
https://docs.ceph.com/en/latest/rados/operations/pg-states/ - Troubleshooting PGs
https://docs.ceph.com/en/latest/rados/troubleshooting/troubleshooting-pg/ - Troubleshooting OSDs
https://docs.ceph.com/en/latest/rados/troubleshooting/troubleshooting-osd/ - Troubleshooting monitors
https://docs.ceph.com/en/latest/rados/troubleshooting/troubleshooting-mon/ - Peering (developer guide
https://docs.ceph.com/en/latest/dev/peering/ - Source: src/osd/PeeringState.h / .cc
https://github.com/ceph/ceph/blob/main/src/osd/PeeringState.h - Source: src/osd/scrubber
https://github.com/ceph/ceph/tree/main/src/osd/scrubber - Source: src/osd/OpRequest.h
https://github.com/ceph/ceph/blob/main/src/osd/OpRequest.h